


Introduction
The continuous development of science and the introduction of new drugs into everyday clinical practice improve the results of lymphoma treatment [1–3]. It is often possible to achieve long-term remission or a complete cure [1, 3]. Long-term survival favors the development of therapy-related neoplasms, which usually develop within ten years of treatment [2, 3]. Most chemotherapy drugs cause DNA damage, including in hematopoietic cells, which accumulates over time, resulting in the development of therapy-related acute myeloid leukemia (t-AML) or myelodysplastic neoplasm (t-MDS) [2]. Additionally, individual predisposition, exposure to other toxic factors, and immunosuppression may influence the risk [1, 2]. Therapy-related acute myeloid leukemia is a well-known clinical entity that evolves as a late complication of previous chemo- or radiotherapy for a primary malignancy. Therapy- related acute myeloid leukemia accounts for approximately 10–20% of all AML cases [4]. Earlier editions of the World Health Organization (WHO) Classification of Hematopoietic Neoplasms distinguished the entity because of the worse prognosis of the patients and typical cytogenetic abnormalities [4, 5]. Some clinical and cytogenetic features were specific for a causative agent: alkylating or topoisomerase II inhibitor [4]. Alkylating drug-related AML is usually preceded by MDS and develops over 2–7 years. A common genetic change is the deletion of chromosomes 5, 7, 13, and TP53 mutations [4, 6, 7]. Acute myeloid leukemia associated with topoisomerase II inhibitors has a shorter development time. Balanced translocations are usually present in cytogenetics, often involving chromosome 11 [4, 6, 7]. Myelodysplastic neoplasm secondary to previous treatment is characterized by a poor response to treatment and a short survival time. Its development is strongly associated with the use of alkylating drugs. In cytogenetics, a deletion in chromosome 7 is often pre-sent [8].
Hodgkin lymphoma (HL) is the most frequently diagnosed hematological malignancy in adolescents, with a 5-year survival rate of 86% [3]. In patients treated with the older chemotherapy regimen MOPP (mechlorethamine, vincristine, prednisone, and procarbazine), the risk of AML was 8-fold higher with ≤ 6 cycles and up to 40-fold higher with more cycles [3]. The mean time from HL treatment to the development of MDS/AML was 31 months [3]. Therapy-related myelodysplastic syndrome/acute myeloid leukemia was primarily associated with the use of alkylating drugs. The current treatment strategies in HL aim to decrease the dose of cytotoxic chemotherapy to minimize the risk of secondary neoplasms, including t-MDS/AML.
In recent years, the outcomes of patients with non- Hodgkin lymphoma (NHL) have also improved. However, NHL comprises a variety of diseases in which different treatment regimens are used, and it is challenging to estimate the frequency of t-MDS/AML [3]. Some historical analyses reported the risk of developing nonlymphocytic leukemia after treating NHL with chemotherapy at 7.9% over ten years [9]. In contrast, t-MDS/AML was not reported in patients treated with radiotherapy alone [9]. More recent studies revealed that the risk in the group treated with chemotherapy was approximately 8% at ten years [10]. Apart from using alkylating drugs, more advanced disease, higher comorbidity score, and administration of granulocyte colony-stimulating agents also affected the risk [10, 11]. In a recently published population-based matched cohort study of 32,100 NHL patients from the Swedish registry, the risk was five-fold higher than in the general population [1].
Therapy-related acute myeloid leukemia after treatment of multiple myeloma (MM) has been widely discussed for several decades. The first reports date back to 1970, when alkylating drugs were the mainstay of treatment [12]. After introducing high-dose melphalan followed by autologous hematopoietic stem cell transplant (ASCT) as a standard in the therapy of MM, analyses did not confirm a higher incidence of secondary MDS/AML in patients undergoing the procedure [13, 14]. In recent years, alkylating drugs have lost their importance in treating MM (except in ASCT), and lenalidomide and other novel agents such as monoclonal antibodies, newer generations of proteasome inhibitors (PI), and immunomodulatory drugs (IMiD) such as lenalidomide have become the standard of care [8]. Since they are widely used in clinical practice for a relatively short time compared to chemotherapy, assessment of the risk of secondary neoplasms requires longer follow-ups. Lenalidomide has been of particular interest because of the risk of secondary malignancies reported in several large trials [15, 16]. However, the recent analysis of the MYELOMA XI trial, which included 4358 patients treated with lenalidomide as first-line treatment, revealed that the frequency of hematological malignancies was low, with an overall incidence of 1.1% for all trial participants [17].
Although the number of t-MDS/AML after lymphoproliferative neoplasms continues to increase, little is known about their clinical characteristics and outcomes. Hence, we performed a retrospective analysis of 57 patients who developed t-MDS/AML after treatment of lymphoproliferative neoplasm. The study’s primary objective was to characterize the population, assess the time to development of secondary neoplasm, and evaluate overall survival (OS) and factors influencing the treatment outcome.
Material and methods
Patients
We performed a multi-center, retrospective study on patients who developed t-AML or t-MDS after lymphoma treatment in 7 hematology departments participating in the Polish Adult Leukemia Group in the period 2011–2018. Anonymized clinical and laboratory data were collected in a case report form. The clinical characteristics included demographic data, performance status at the time of diagnosis of primary and secondary neoplasm, data about the diagnosis and treatment of prior malignancy, and details about secondary MDS/AML (cytogenetic/molecular risk, treatment).
Definitions and diagnosis
The myelodysplastic syndrome subtypes were diagnosed according to the 2016 Revision of the WHO Classification of myeloid neoplasm [5]. The assessment of the prognosis of MDS patients was based on the International Prognostic Scoring System as described elsewhere [18]. The cytogenetics and molecular risk factors of AML were classified according to European LeukemiaNet (ELN) 2010 [19]. The latency to the onset of MDS/AML was calculated in months from the diagnosis of the primary neoplasm to the diagnosis of MDS/AML.
Statistical analysis
Nominal variables were reported as percentages and analyzed using the chi-square test with the relevant corrections: the Yates continuity correction or Fisher’s exact test. The paired comparison of nominal variables was conducted using the McNemar test. The Shapiro-Wilk test was used to verify the normality of the distribution of continuous data. The Mann-Whitney U test was used to compare continuous variables reported as medians with interquartile (IQR) values. Survival analyses were performed using a Kaplan-Meier estimate and univariate and multivariate Cox’s proportional hazards models. Survival curves were compared using the log-rank test. The optimal cutpoints of continuous predictors for survival curve visualizations were selected using Cutoff Finder [20]. P-values below 0.05 were considered statistically significant. All statistical analyses were performed on Statistica Version 13.1 (TIBCO, Palo Alto, CA, USA).
Results
We analyzed 28 women and 29 men diagnosed with t-MDS (n = 38) and t-AML (n = 19). The clinical characteristics of the patients with t-MDS/AML secondary to the primary lymphoid malignancy are provided in Table 1.
Table 1
Clinical characteristics of included patients with myelodysplastic syndromes/acute myeloid leukemia secondary to the primary lymphoid malignancy
AML – acute myeloid leukemia, auto-HSCT – autologous hematopoietic stem cell transplantation, CLL – chronic lymphocytic leukemia, DLBCL – diffuse large B-cell lymphoma, EB – excess of blasts, ECOG – Eastern Cooperative Oncology Group, HL – Hodgkin lymphoma, IHD – ischemic heart disease, IPSS – International Prognostic Scoring System, IQR – interquartile range, MCL – mantle cell lymphoma, MDS – myelodysplastic syndrome, MLD – multilineage dysplasia, MM – multiple myeloma, SLD – single lineage dysplasia, WBC – white blood cells, WHO – World Health Organization
Characteristics of patients with primary lymphoid neoplasms
The time range of diagnosis of lymphoid neoplasm was 1990–2018. Overall, the most common primary lymphoid neoplasm in our study cohort was MM (n = 16, 28.1%), followed by HL (n = 14, 24.6%) and diffuse large B-cell lymphoma (DLBCL) (n = 14, 24.6%). The median age at diagnosis of primary malignancy was 60 years (IQR: 49–64, range: 12–77). The median time between diagnosis of lymphoid neoplasm and the onset of t-MDS/AML was 58.7 months (95% CI: 44.2–68.5 months). There was no statistically significant difference in time to t-MDS/AML regarding the type of primary neoplasm (log-rank test, p = 0.3698). Most patients (n = 31, 54.4%) had an advanced stage of primary lymphoid malignancy (Ann Arbor stage III–IV for lymphomas or stage III in the Durie-Salmon classification in the case of MM patients). However, the majority of patients had a good (0–2) performance status assessed by the Eastern Cooperative Oncology Group (ECOG) scale (n = 37, 64.9%). 49.1% of patients had comorbidities, among which the most common were hypertension (n = 14, 24.6%), followed by ischemic heart disease (n = 5, 8.8%), peptic ulcers (n = 5, 8.8%) and diabetes (n = 5, 8.8%).
Treatment of primary lymphoid neoplasms
The patients with MM most commonly received the cyclophosphamide, thalidomide, and dexamethasone (CTD) regimen (43.8%), followed by vincristine, doxorubicin, dexamethasone (VAD) (18.8%) and bortezomib, melphalan, and prednisone (12.5%). Hodgkin lymphoma patients mainly received Adriamycin (doxorubicin), bleomycin, vinblastine, and dacarbazine (ABVD) with or without radiotherapy (57.1%) and A + brentuximab vedotin, doxorubicin, vinblastine, and dacarbazine (14.3%). The most common chemotherapy regimen in DLBCL patients was cyclophosphamide, doxorubicin, prednisone, rituximab, and vincristine (R-CHOP) (64.3%) followed by etoposide, prednisone, vincristine, cyclophosphamide, doxorubicin, and rituximab (DA-EPOCH-R) (21.4%). Chronic lymphocytic leukemia (CLL) patients mostly received FC (fludarabine and cyclophosphamide) (42.9%). Seventeen patients (29.8%) had relapsed/refractory (RR) disease. The median number of treatment lines in RR patients was 3 (range: 1–6). Resistant disease most often occurred in patients with MM (9), followed by DLBCL (3), mantle cell lymphoma (MCL) (2), HL (2), and CLL (1). Overall, 15 patients (26.3%) underwent ASCT – 5 with MM, 5 HL, 3 DLBCL, and 2 MCL patients. Our study cohort had no allogeneic hematopoietic stem cell transplantations (alloSCT) due to lymphoid neoplasms.
Characteristics of secondary myelodysplastic syndrome/acute myeloid leukemia patients
The median age of the study population at the time of t-MDS/AML diagnosis was 65 (IQR: 57–71, range: 25–92). Overall, 38 patients were diagnosed with t-MDS, and 19 had t-AML. Seven patients (12.3%), 6 with t-MDS and one with t-AML, were diagnosed during treatment of primary lymphoid neoplasm. At the time of diagnosis of t-MDS/AML, the patients presented with significantly poorer performance (> 2) according to the ECOG scale compared with the status at primary diagnosis (61.4% vs. 12.3%, McNemar test p < 0.0001).
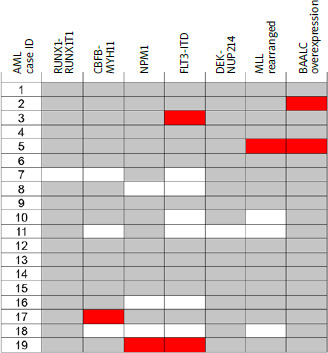
The most common type in our study was MDS with ring sideroblasts (21.1%), followed by MDS with multilineage dysplasia (MDS-MLD) (21.1%), MDS with excess blasts 2 (MDS-EB2) (18.4) and MDS unclassifiable (18.4%). Cytogenetics was available for 33 patients. Fourteen patients had poor or very poor karyotype, according to the Revised-International Prognostic Scoring System (R-IPSS), 10 had normal karyotype, 2 had favorable karyotype, and 7 had other abnormalities, classified as intermediate-risk karyotype. Based on that, the group distribution in R-IPSS was as follows: very low – 2 patients; low – 8; intermediate – 8, high – 5, very high – 10. Fourteen (36%) MDS patients had unfavorable risk factors such as complex karyotype or monosomy of chromosome 7. According to the International PSS (IPSS), 4 (12%) patients were of low risk, 10 (30%) intermediate-1, 16 (48%) intermediate-2, and 3 (9%) of high risk. The cytogenetics was available for 14 AML patients, and the molecular profile was known for 10 patients. Of these, 4 (28%) had poor cytogenetic risk (2 had complex and 2 monosomal karyotype), 2 (14%) had favorable risk, 3 (21%) intermediate-1 risk, and 5 (35%) intermediate-2 risk according to the ELN 2010 classification. Molecular assessment was available for 11 patients. FLTs-ITD (n = 2) and brain and acute leukemia, cytoplasmic (n = 2) were the most common mutations. The mutational landscape of AML patients is presented in Figure 1. Due to the small sample size in each category, for further analyses, we combined patients from AML and MDS groups with poor cytogenetic risk as described above and separated the group as “unfavorable molecular and cytogenetics risk factors”.
Fig. 1
Mutational landscape of 19 therapy-related acute myeloid leukemia cases in the study cohort
Mutations recognized in European LeukemiaNet 2010 classification and brain and acute leukemia, cytoplasmic overexpression are shown. Overall, the approach for molecular diagnostics varied between study sites and was based on investigation of only several selected abnormalities in each patient. Filled boxes (red) represent cases with mutations present, and white boxes represent no mutation. Grey color represent missing data. AML – acute myeloid leukemia BAALC – brain and acute leukemia, cytoplasmic, MLL – mixed-lineage leukemia
Therapy-related acute myeloid leukemia patients were treated mainly with the daunorubicin, cytarabine, and cladribine (DAC) regimen (7, 36.8%), followed by daunorubicin and cytarabine (DA) (3, 15.8%). Among 10 t-AML patients treated with intensive chemotherapy, 6 achieved a complete response (CR). Three patients received azacitidine (15%); the others received palliative treatment (hydroxyurea and best supportive care). Myelodysplastic syndrome patients were treated most commonly with azacitidine (47.4%), followed by best supportive care for the others. Ten patients (5 AML and 5 MDS patients) underwent allogeneic hematopoietic stem cell transplantation.
Factors influencing overall survival of secondary myelodysplastic syndrome/acute myeloid leukemia patients
The median OS since the t-MDS/AML diagnosis was 16.1 months, 95% CI: 10.8–23.6 months. The median OS for the patients who underwent alloSCT was 24.30 months (95% CI: 19.30 to 24.30), while for the remaining group it was 12.9 months (95% CI: 8.60–21.20). Therapy-related acute myeloid leukemia patients did not have significantly shorter OS than t-MDS patients (HR 1.35, 95% CI: 0.68–2.68, p = 0.3593) (Fig. 2 A). In univariate Cox regression analysis, alloSCT (HR 0.32, 95% CI: 0.16–0.66, p = 0.0223) and diagnosis of HL compared to other lymphoid malignancies (HR 0.52, 95% CI: 0.27–0.99, p = 0.0408) were significant protective factors influencing OS (Table 2). On the other hand, the unfavorable molecular and cytogenetic risk factors considerably shortened OS (HR 3.22, 95% CI: 1.39–7.50, p = 0.0002).
Fig. 2
Overall survival (OS) of patients with therapy-related myelodysplastic syndrome/acute myeloid leukemia (t-MDS/AML) since diagnosis (A). Independent prognostic factors influencing OS of patients with t-MDS/AML: presence of unfavorable molecular and cytogenetic risk factors (B), platelets (C), and hemoglobin level (D)
AML – acute myeloid leukemia, CI – confidence interval, Hb – hemoglobin, HR – hazard ratio, MDS – myelodysplastic syndrome, PLT – platelets
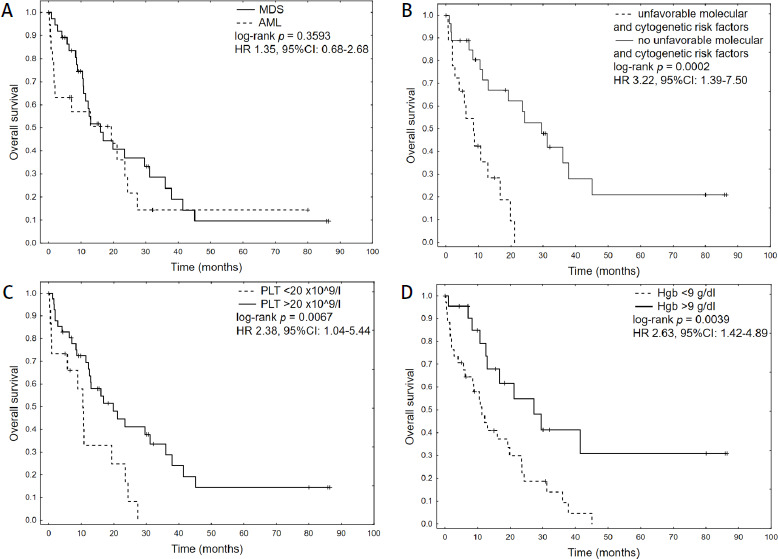
Table 2
Univariable Cox regression model of factors influencing the overall survival of patients with therapy-related neoplasms such as myelodysplastic syndrome and acute myeloid leukemia
[i] AlloHSCT – allogeneic hematopoietic stem cell transplantation, AML – acute myeloid leukemia, auto-HSCT – autologous hematopoietic stem cell transplantation, CI – confidence interval, ECOG – Eastern Cooperative Oncology Group, HL – Hodgkin lymphoma, HR – hazard ratio, MDS – myelodysplastic syndrome, PLT – platelets, WBC – white blood cells
Autologous hematopoietic stem cell transplant during the treatment of primary lymphoid malignancy (HR 1.20. 95% CI: 0.51–2.51, p = 0.6131), relapse of primary lymphoid disease (HR 0.80, 95% CI: 0.38–1.70, p = 0.5832) and ECOG > 2 at time of diagnosis of t-MDS/AML (HR 0.91, 95% CI: 0.49–1.75, p = 0.7836) did not influence OS of t-MDS/AML patients. Among laboratory variables, only platelets > 20 G/l (HR 0.9943, 95% CI: 0.9900–0.9987, p = 0.0112) and hemoglobin level > 9 g/dl (HR 0.75, 95% CI: 0.63–0.89, p = 0.0011) were predictors of better OS.
Significant factors in univariate analyses were used for multivariate Cox regression model construction. The presence of unfavorable molecular and cytogenetic risk factors, hemoglobin level, and platelets were found to be independent prognostic factors influencing the outcome of secondary MDS/AML patients (Table 3). The corresponding Kaplan-Meier plots for established predictors are presented in Figure 2 B–D.
Table 3
Multivariable Cox regression model of factors influencing overall survival of patients with therapy-related neoplasms such as myelo-dysplastic syndrome and acute myeloid leukemia
Discussion
This study analyzed the clinical characteristics and outcome of t-MDS/AML diagnosed in patients with a history of lymphomas and MM. Our analysis adds more detailed information about clinical characteristics and treatment outcomes compared to larger, population-based studies that are more precise in terms of epidemiological data. Indeed, the study’s results validate and confirm some previously published data.
The median time between the diagnosis of lymphoid neoplasm and the onset of t-MDS/AML in our cohort was 58.7 months. This corresponds to the mean latency length after treatment with alkylating agents [6, 7]. Nearly 2/3 of our patients in the whole cohort received an alkylating agent in the chemotherapy regimen. The results are comparable to a previous study by Bertoli et al., which analyzed 80 patients with AML secondary to lymphoma treatment received between 1997 and 2022 [21]. The median age of diagnosis of AML was 66 years, with a median latency of 60 months. About half of the patients received CHOP-like regimens as a treatment for lymphoma, and nearly all received an alkylating agent in the first or subsequent lines of treatment [21]. However, the analysis did not include MM patients. Another study from an Irish center described 39 patients with t-MDS/AML, in which 24 (61.5%) patients had a hematological malignancy (AML – 5; NHL – 5; HL – 1; MM – 7; CLL – 2; other – 4) as a primary neoplasm [22]. However, that study’s time to diagnosis (46 months) was shorter than ours [22].
Nearly 30% of subjects in our cohort were patients with MM. The most common regimen applied in MM patients was CTD, followed by VAD. Both are not currently recommended due to the availability of new, more effective therapies [23]. Five of our MM patients had ASCT, which remains the standard treatment for MM in younger patients. A study by Sahebi et al. from the European Bone Marrow Transplantation (EBMT) registry, which included 3204 patients with MM who underwent a first ASCT between 2008 and 2012, tried to determine the true incidence of secondary malignancies [24]. The induction regimens were as follows: alkylating agent +IMiD (19.1%), PI (19%), PI +IMiD (16.4%), alkylating agent +PI (15.2%), alkylating agent (10%), alkylating agent +IMiD +PI (7%), IMiD (7.4%). Second primary malignancies developed in 135 patients (4.3%) after 60 months of follow-up. Therapy-related myelodysplastic syndrome/acute myeloid leukemia was diagnosed in 18 patients (13%); the remaining cases were solid tumors. The study results revealed non-significantly higher incidence of t-MDS/AML after induction therapy containing alkylating agents and IMiD. In contrast, the risk was lower after PI alone. However, these differences did not reach statistical significance [24]. Wang et al. assessed the incidence of secondary neoplasms in a Chinese population-based study which included 43,825 patients diagnosed with MM between 1975–2018 [25]. Six hundred eighty patients were diagnosed in 2010–2018 and treated with IMiD, PI, and anti-CD38 monoclonal antibody [25]. In the latter population, t-MDS/AML was diagnosed in 59 patients (8%). The percentage of t-AML diagnosis was the highest in the 1970s, reaching 9%, but during the following decades, it decreased. In the study, the t-MDS was reported only from 2002. The risk of t-MDS/AML increased with time after MM diagnosis, reaching the highest risk after 5–10 years. Compared to the entire population, the risk of secondary cancers has decreased since the 1970s, proving the importance of alkylators in tumorigenesis [25]. Pemmaraju et al. analyzed 47 patients with MM treated in the period 1993–2011 who developed secondary myeloid malignancy [26]. Similar to our group, more than half of the patients received initial treatment based on an alkylating agent. The latency to developing secondary malignancy was seven years, slightly longer than in our study but still typical for alkylating agent-based primary therapy. The median OS for the whole cohort was 6.3 months but was longer in patients who underwent alloSCT (18.3 months) [26].
The median OS of t-MDS/AML in our analysis was 16.1 months. Survival did not differ significantly between AML patients and MDS patients. The factors influencing duration of OS in our cohort in univariate analyses were alloSCT for treating t-MDS/AML, primary diagnosis of HL, platelets (PLT) > 20 G/l, and hemoglobin > 9 g/dl at the time of diagnosis. Unfavorable cytogenetics was associated with shorter survival; however, in multivariate analyses, only hemoglobin and PLT levels at the time of t-MDS/AML diagnosis and adverse molecular and cytogenetic risk factors were independent predictors of outcome. As many as 31% of patients had complex or monosomal karyotype, typical abnormalities for therapy-related myeloid neoplasms [27]. Multivariable analysis confirmed the impact of unfavorable cytogenetics on OS (HR 2.88, 95% CI: 1.29–6.42, p = 0.009), which aligns with previously published data [5, 28]. The importance of alloSCT on prolonged survival, which we demonstrated in our cohort, is consistent with the previous analyses [26, 29, 30].
The treatment strategy of HL in the past few decades has changed enormously. The goal constantly sought was the best possible treatment effectiveness with the lowest long-term toxicities. The current chemotherapy with the ABVD regimen, the reduction of dose due to the positron emission tomography-based management, and the reduction of radiotherapy from extended-field to involved-field has also decreased the risk of secondary malignancies in general [31]. In fact, in some studies, no t-AML cases were reported in patients treated with radiotherapy alone or ABVD chemotherapy [3, 32, 33]. In our cohort, most patients were treated with ABVD-based regimens with or without radiotherapy. The median age at diagnosis of t-MDS/AML was younger than the entire group (50 years), which, in turn, resulted in more aggressive treatment of t-MDS/AML, including alloSCT, in 10 patients. Bertoli et al. analyzed 80 patients with t-AML who were treated because of lymphoma in the period 1997–2012. The most common type was indolent NHLs (n = 40), followed by aggressive NHLs (n = 28), HL (n = 14), and others (n = 7) [21]. The median age at the time of the diagnosis of lymphoma was 60 years. All but six patients received chemotherapy with or without radiotherapy or rituximab. The median delay to t-AML was 60 months, and the median OS was 7.7 months. Interestingly, the OS varied depending on the type of lymphoma: patients with DLBCL and HL had longer OS (73 and 24 months, respectively), whereas patients with CLL and MCL had significantly shorter OS (3.7 months and 4.3 months, respectively). These may be attributed to several factors, e.g., younger age of HL and DLBCL patients and more aggressive treatment, which increase the chance of achieving CR [34, 35]. Both results underline the advantage of age in therapy: the younger the patient, the more aggressive treatment he may receive, regardless of whether it is primary or secondary neoplasm. This, in turn, translates into the chances of achieving CR and longer survival.
In our analysis, ASCT during the treatment of primary malignancy did not influence the OS. These results might be partially explained by the small sample and the small percentage of patients who underwent the procedure (26%). The literature has widely discussed that aspect of MM or lymphoma treatment [13, 14, 36]. It is difficult to determine whether this is related to the treatment of the primary neoplasm or the HSCT procedure [6]. The available data show fewer stem cells collected, and more apheresis may be risk factors for t-MDS/AML after HSCT [3]. Over the years, it was believed that treatment with high-dose melphalan contributes to the development of t-MDS/AML. However, ASCT alone did not increase the risk [13, 14]. A large analysis of European Bone Marrow Transplantation (EBMT) on therapy-related leukemia and myelodysplasia after autografting for lymphoma, including over 7500 lymphoma patients who underwent ASCT, also revealed that the procedure is not a risk factor for t-MDS/AML [37].
The observed association between hemoglobin and platelet levels at the time of t-MDS/AML diagnosis and their impact on OS highlights the potential importance of these hematological parameters for predicting outcomes in this patient population. It is plausible that anemia upon diagnosis of t-MDS/AML may serve as a surrogate marker for a more advanced state, potentially indicating an inferior prognosis. Multiple factors, such as myelosuppressive therapies, impaired megakaryocyte function, and bone marrow infiltration by leukemic cells, can lead to thrombocytopenia. In addition, thrombocytopenia may indicate more severe impairment of bone marrow function, indicating an increased disease burden or a more aggressive leukemia phenotype. Indeed, both anemia and thrombocytopenia were previously reported to be associated with inferior outcomes regarding OS in therapy-related myeloid neoplasms [35, 38]. The effect of hemoglobin and platelet levels on overall survival in patients with t-MDS/AML highlights the significance of early recognition and monitoring of these hematological parameters during the diagnostic workup and subsequent follow-up. Clinicians should consider incorporating these factors into risk stratification models to facilitate treatment decision-making and prognostic evaluation.
Limitations of the study
It should be underlined that the study’s retrospective nature, the relatively modest number of patients, and their heterogeneity are important limitations of our analysis. Furthermore, the long observation period and significant changes in standard lymphomas and t-MDS/AML treatments should be considered when interpreting our observations.
Conclusions
In conclusion, our results show that t-MDS/AML after lymphoma treatment is associated with a dismal prognosis mainly due to poor cytogenetics and molecular risk. In addition, poor performance status and comorbidities often prevent alloSCT. The depth of anemia and thrombocytopenia may reflect the impairment of the bone marrow function and worsen the treatment results.