


Introduction
Of all allergic diseases, the most widespread is allergic rhinitis (AR) [1, 2]. Its prevalence is believed to be 30% of all adults and 40% of children in the US [3, 4], and 23–30% in Europe [5]. There is hence a great interest in identifying the new factors underlying the pathogenesis of AR.
It is possible that the presence of lipid metabolism disorders may influence allergic diseases, including AR. Allergic diseases, especially chronic forms with numerous exacerbations, cause the release of pro-inflammatory factors, which may act as risk factors in the development of atherosclerosis [6]. The damaged vascular endothelium has been found to contain mast cell infiltrates which may be involved in the formation and remodelling of atherosclerotic plaques [7]. AR increases the risk of both coronary artery disease and peripheral vascular disease [8].
Hypercholesterolaemia may shift the immune balance towards Th2-dependent reactions, promoting interleukin (IL) 1 (IL-1), IL-4, IL-6 and IL-17 secretion, while reducing IL-10 secretion [9–11]. Increased low-density lipoproteins (LDL) and triglyceride (TG) levels have pro-inflammatory effects associated with increased tumor necrosis factor-α (TNF-α) and IL-6 expression [12, 13], while high-density lipoproteins (HDL) exert anti-inflammatory properties via T-lymphocyte activation [7]. In adults with AR, HDL values inversely correlate with the group II innate lymphoid cells (ILC2) that initiate Th2-dependent allergic reactions following stimulation by inter alia TSLP [14].
Total cholesterol (TC) and LDL levels correlate with the severity of AR in the paediatric population [15], and adults with AR and dyslipidaemia have poorer quality of life than those without dyslipidaemia [16]. Higher HDL values indicate a reduced likelihood of developing AR in children with a family history of allergies. Lipid metabolism also influences the risk of sensitization to inhalation allergens and nitric oxide concentrations in the lower respiratory tract (FeNO) [17].
Among adults with AR, dyslipidaemia was associated with allergy to hay dust and mites (mixed mites) and higher total IgE (tIgE) and IL-17A values than those without lipid disorders [11]. Abnormal lipid metabolism parameters, i.e. elevated TG and decreased HDL, are associated with more frequent episodes of wheezing, in patients with rhinitis and those without upper respiratory tract symptoms [18]. Rosuvastatin therapy significantly reduced airway hyperresponsiveness in Wistar rats with simple asthma or asthma accompanied by dyslipidaemia [19].
The prevalence of dyslipidaemia in patients with AR and its impact on the clinical course of the disease remains unresearched, especially among children.
Aim
The aim of the present study was to analyse selected lipid metabolism parameters in a group of Polish children with AR. It also examines the relationship between the occurrence of lipid metabolism disorders and the clinical course of AR, the profile of sensitization to airborne allergens, FeNO values, nasal nitric oxide concentration (nNO) and the occurrence and severity of bronchial hyperresponsiveness (BHR).
Material and methods
Approval was given by the Collegium Medicum in Bydgoszcz, Nicolaus Copernicus University in Torun (CM NCU) Bioethics Committee (No. KB 391/2017). All the caregivers and all patients aged 16 years old and older signed the consent form. This was a case-control study.
Patients
The patient group was recruited from children hospitalized at the Department of Paediatrics, Allergology and Gastroenterology, CM in Bydgoszcz (Poland) and treated by the Allergology Outpatient Clinic from 1 October 2017 to 31 December 2019. In total, 120 children were included: 80 in the study group (with AR) and 40 in the control group (without AR). The study group was also divided into two subgroups: AR alone (AR group, n = 52 children) and AR and comorbid asthma (AR with asthma group, n = 28 children). Each of the patients was once hospitalized in the Department for scheduled diagnostics.
AR was diagnosed according to the Allergic Rhinitis and its Impact on Asthma (ARIA) guidelines [1]. Asthma was diagnosed according to the Global Initiative for Asthma (GINA) guidelines [20]. The inclusion and exclusion criteria for the test and control groups are presented in Table 1.
Table 1
Inclusion and exclusion criteria for the study and control groups
| Inclusion criteria for the study group | Inclusion criteria for the control group | Exclusion criteria for the study and control groups |
|---|---|---|
| Age > 7 y.o. and < 18 y.o. Diagnosis of allergic rhinitis according to ARIA guidelines Diagnosis of asthma according to GINA guidelines* | Age > 7 y.o. and < 18 y.o. Children without rhinitis and asthma symptoms in the past and now | Age < 7 y.o. and ≥ 18 y.o. Respiratory tract infections during the last 6 weeks Diagnosis of nonallergic rhinitis Anatomical abnormalities of nose and face structures Chronic diseases of the lower respiratory tract (asthma#, cystic fibrosis, primary ciliary dyskinesia, sarcoidosis) Allergen immunotherapy in the past and now Eosinophilic esophagitis FEV1 < 60% predicted Inability to perform any of the testing manoeuvres (for example spirometry manoeuvres) |
Classification of allergic rhinitis
AR was classified based on the frequency of symptoms during the last year, in accordance with the ARIA guidelines [1]: intermittent AR (iANN) was indicated by the occurrence of AR symptoms for less than 4 days a week or less than 4 weeks a year, and persistent allergic rhinitis (pANN) by AR symptoms occurring for at least 4 days a week and lasting at least 4 weeks. This was confirmed by an interview with the patient and his/her legal guardian.
The severity of allergic rhinitis
The severity of allergic rhinitis was assessed using two methods:
in accordance with the ARIA guidelines: Mild AR was defined as symptoms that do not disturb sleep, daily activities (including sports), study or work, and the patient does not consider them bothersome, while moderate/severe AR was indicated by symptoms disturbing patient functioning in at least one area of life (sleep, daily activities, including sports, study, work) or that were considered bothersome by the patient.
based on the Total Nasal Symptom Score (TNSS) [21] with our own modification: The patients were asked to rate the severity of each of the five symptoms of AR (nasal itching, nasal blockage, runny nose, sneezing, itching/watery eyes) on a scale of 0–3 points (max 15 points): 0 points – symptom is absent; 1 point – the symptom is mildly severe; 2 points – the symptom is moderately severe; 3 points – the symptom is severe.
Survey
The questionnaire (50 questions) was created based on the validated ISAAC questionnaire [22]. The first part (22 questions) concerned the presence of allergic disease symptoms, i.e. asthma, AR and atopic dermatitis (AD). The second part (28 questions) concerned risk factors for the development of allergies, family history of allergic diseases, having siblings, perinatal interview, physical activity, time using a computer and/or TV, exposure to air pollution, contact with pets, vitamin D3 supplementation, social welfare conditions, and maternal education level.
Skin prick tests
Skin prick tests (SPT) were performed using the prick method with standardized reagents from Allergopharma - Nexter (Reinbek, Germany), according to the European Academy of Allergy and Clinical Immunology (EAACI) recommendations [23]. The children were tested for allergy to grass pollen, rye, alder, hazel, birch, mugwort, plantain, Dermatophagoides pteronyssinus, Dermatophagoides farinae, dog dander, cat dander and mould (Alternaria alternata, Aspergillus fumigatus, Cladosporium herbarum).
TIgE in the blood serum
The serum tIgE level was determined by ELISA testing. The following values were regarded as abnormally high, according to age: > 393.0 IU/ml (7–10 years of age); > 179.0 IU/ml (11–15 years of age); > 378.0 IU/ml (> 16 years of age).
Concentration of allergen-specific IgE against airborne allergens
The Polycheck method (Biocheck GmbH, Munster, Germany) was used to determine blood serum allergen-specific IgE (asIgE) levels for the following allergens: birch pollen, alder, hazel, timothy, rye, mugwort, plantain, D. pteronyssinus, D. farinae, dog dander, cat dander, Aspergillus fumigatus, Cladosporium herbarum, Penicillium praktum, and Alternaria alternata. The presence of asIgE against a given allergen in the titre ≥ 0.35 kU/l was considered evidence of sensitization.
Assessment of bronchial hyperresponsiveness
BHR was assessed by a methacholine challenge test using the Lungtest 1000 apparatus and the MES ISPA in accordance with the European Respiratory Society (ERS) recommendations [24]. The tests used 0.0625, 0.25, 1.0, 4.0 and 16 mg/ml methacholine solutions in physiological saline. BHR severity (borderline, mild, moderate, marked) was determined by PD20, i.e. the dose of a provoking substance causing a 20% reduction in FEV1 (mg).
Measurement of FeNO
The FeNO measurement was performed using the Medisoft HypAir FeNO apparatus. The patient was first asked to breathe out gently past the mouthpiece of the apparatus; the mouthpiece was then inserted into the mouth; the participant inhaled and exhaled gently through the mouthpiece. The exhalation time was at least 6 s. At least two FeNO measurements were performed for each patient, and the mean taken as the final result. The results were interpreted in accordance with the American Thoracic Society (ATS) recommendations [25, 26].
Measurement of nNO
nNO was measured using Medisoft HypAir FeNO apparatus. The patient breathed through the mouthpiece at an appropriate intensity, monitored by a scale displayed on the screen, while a silicone tip connected to a nitric oxide analyser was placed at the nostril. The mean value of the measurements from both nostrils was taken as the final result. The study was conducted in accordance with ATS recommendations [25, 26].
Assessment of lipid metabolism parameters
Blood serum TC, LDL, HDL and TG concentration was determined using an ARCHITECTcSystem analyser. The results, interpreted according to the test safety data sheet, are presented in Table 2.
Statistical analysis
The distribution of continuous variables was tested using the Shapiro-Wilk test. The results were presented as median (Me) and lower (Q1) and upper (Q3) quartiles, minimum (Min) and maximum (Max). Categorical variables are presented as absolute number (N) and percentage. For continuous variables, differences between individual subgroups were evaluated using the Mann-Whitney U-test (two groups), or the ANOVA 40-rank Kruskal-Wallis test (three and more groups). Categorical variables were tested with the χ2 test. The parameters were compared using a linearized simple or multiple regression model. P-values < 0.05 were considered statistically significant. Statistica v. 13.1 (StatSoft Polska) was used for all tests.
Results
No statistically significant differences in birth or sociodemographic parameters were found between the study and control groups (p > 0.05). The characteristics of the test and control groups are presented in Table 3.
Table 3
The characteristics of the study and control groups
Characteristics of AR
Most children in the study group, regardless of the coexistence of asthma with AR, had pAR indicating a moderate/severe impact on daily functioning (Table 4). Our assessment of the occurrence and severity of symptoms of AR, according to our modified TNSS scale, found that children with AR were most likely to complain of nasal congestion (n = 47; 90.38%), and least likely to report nasal itching (n = 34; 65.38%). Similarly, patients with AR and asthma were most likely to report nasal congestion (n = 27; 96.43%), and least likely to report itching/watery eyes (n = 19; 67.86%). The studied groups did not differ significantly regarding the frequency of the individual symptoms of AR (p > 0.05).
Table 4
Classification of AR in the study group
| Parameter | Study group n = 80 (100%) | P-value | ||
|---|---|---|---|---|
| AR n = 52 (100%) | AR + asthma n = 28 (100%) | Total | ||
| Type of AR: | ||||
| According to ARIA [1]: | ||||
| Intermittent | 16 (30.77) | 7 (25.00) | 23 (28.75) | 0.05 |
| Persistent | 36 (69.23) | 21 (75.00) | 57 (71.25) | |
| Severity of AR: | ||||
| According to ARIA [1]: | ||||
| Mild | 4 (7.70) | – | 4 (5.00) | > 0.05 |
| Moderate/severe | 48 (92.30) | 28 (100.00) | 76 (95.00) | |
| According to TNSS [21], mean ± SD | 7.6 ±3.7 | 8.4 ±3.3 | 8.0 | > 0.05 |
Characteristics of lipid metabolism parameters
No significant differences in individual lipid metabolism levels were found between the study and control groups (p > 0.05) (Table 5). However, both the children with AR alone and those with AR and asthma were significantly more likely to have normal HDL levels than those from the control group (p = 0.030; p = 0.030). In addition, children with AR did not differ from those with AR and asthma in terms of the HDL level (p = 0.720) (Table 6).
Table 5
TC, HDL, LDL and TG values in the study and control groups
Table 6
TC, HDL, LDL and TG levels in the study and control groups according to the test safety data sheet
| Parameter | Study group n = 80 (100%) | Control group n = 40 (100%) | P-value | |
|---|---|---|---|---|
| AR n = 52 (100%) | AR + asthma n = 28 (100%) | |||
| TC: | ||||
| Normal | 29 (55.77) | 15 (53.57) | 30 (75.00) | 0.150* |
| Moderately high | 16 (30.77) | 11 (39.29) | 7 (17.50) | 0.130** |
| High | 7 (13.46) | 2 (7.14) | 3 (7.50) | 0.570*** |
| HDL: | 0.030* | |||
| Low | 7 (13.46) | 3 (10.71) | 13 (32.50) | 0.030** |
| Normal | 45 (86.54) | 25 (89.29) | 27 (67.50) | 0.720*** |
| LDL: | ||||
| Normal | 29 (55.77) | 17 (60.71) | 28 (70.00) | 0.370* |
| Moderately high | 19 (36.54) | 7 (25.00) | 10 (25.00) | 0.400** |
| High | 4 (7.69) | 4 (14.29) | 2 (5.00) | 0.440*** |
| TG: | ||||
| Normal | 33 (63.46) | 20 (71.43) | 27 (67.50) | 0.060* |
| Moderately high | 17 (32.69) | 6 (21.43) | 7 (17.50) | 0.580** |
| High | 2 (3.85) | 2 (7.14) | 6 (15.00) | 0.490*** |
Lipid metabolism parameters and the occurrence and severity of bronchial hyperresponsiveness, FeNO and nNO concentration, and the severity of AR symptoms
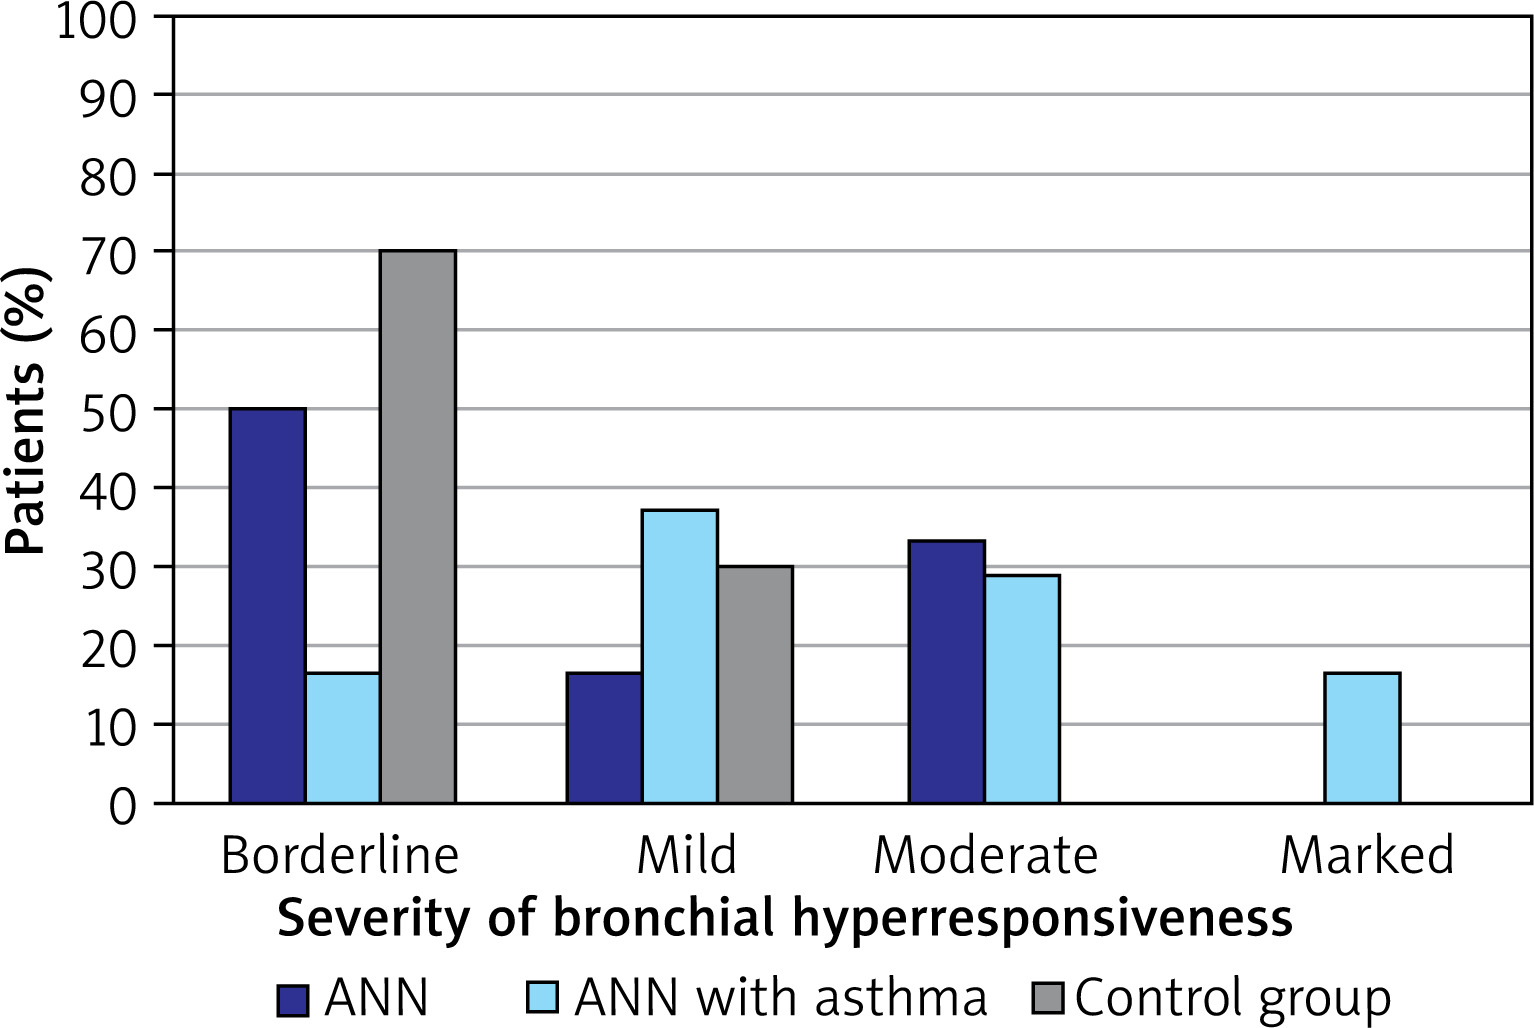
In the studied group of patients, BHR was most common in children with AR and asthma (n = 24; 85.71%); this value was also significantly more common than in the group of children with AR alone (n = 18; 34.62%; p < 0.001) or the control group (n = 10; 25.00%; p < 0.001). BHR was also significantly more common in the children with AR alone than in the control group (p < 0.001). The distribution of BHR severity among the studied patients is shown in Figure 1.
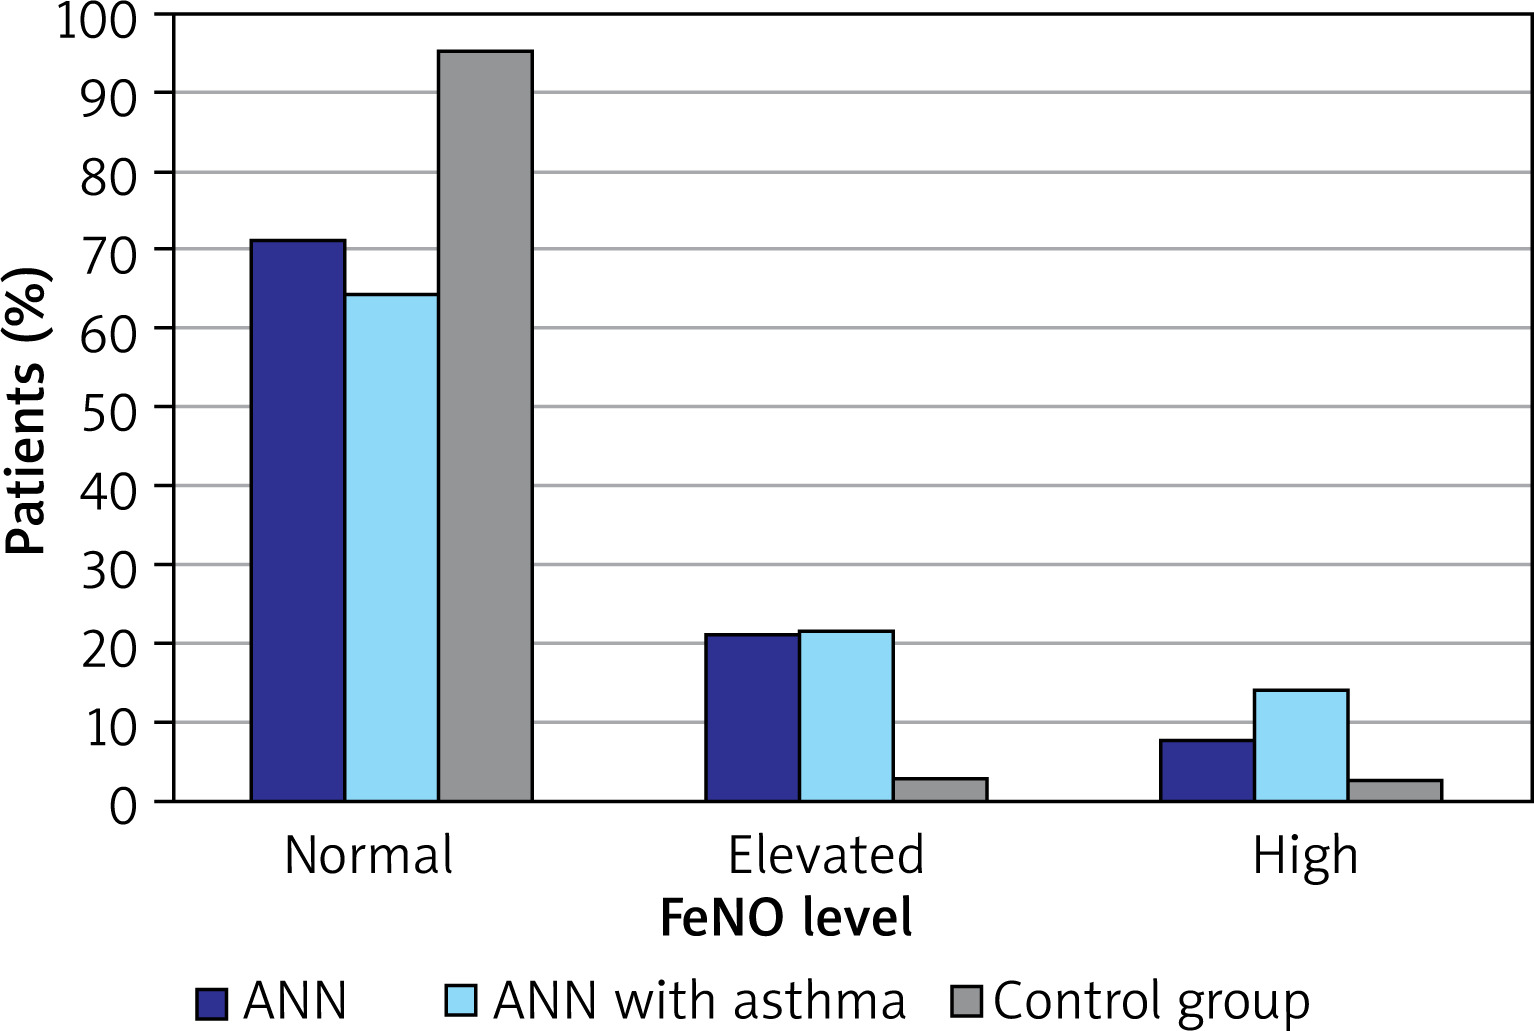
Elevated and high FeNO values were significantly more common among children with AR and asthma than in the control group (p = 0.004). Similarly, elevated and high FeNO was significantly common in children with AR alone than in controls (p = 0.006). The distribution of FeNO levels in the study and control groups is shown in Figure 2.
Figure 2
The classification of FeNO level according to ATS/ERS guidelines in the study and control groups
The highest nNO values were found in the ANN group (Me = 1688.3 ppb) and they were comparable with the values in the control group (Me = 1658.0 ppb). In turn, the lowest values of nNO were found in children with AR and asthma (Me = 1446.3 ppb). All groups were characterised by similar median nNO values (p = 0.420).
In the group of children with AR, the most severe symptoms (according to TNSS) were nasal blockage ( ± SD = 1.7 ±0.9) and sneezing ( ± SD = 1.7 ±1.0), and the least severe was nasal itching ( ± SD = 1.1 ±1.0). In the case of children with AR and asthma, the greatest severity was associated with nasal blockage ( ± SD = 2.1 ±0.7), and the lowest with nasal itching ( ± SD = 1.4 ±1.0) and itching / watery eyes ( ± SD = 1.4 ±1.1). A similar severity of individual AR symptoms was observed between the children with AR alone and those with AR and asthma (p > 0.05).
No significant correlations were found between the lipid profile values and the occurrence and severity of BHR, as well as with FeNO and nNO concentrations in the study group (p > 0.05). Similarly, in the study group, no correlation was found between the severity of AR symptoms (TNSS) and the occurrence of abnormalities in the lipid profile (p > 0.05) (Table 7).
Table 7
The relationship between lipid parameter values and BHR occurrence and severity, FeNO and nNO concentrations and TNSS
Lipid metabolism parameters and tIgE values and sensitization to airborne allergens
The highest tIgE values were found in the group of children with AR and asthma (Me = 179.75 IU/ml), and the lowest in the control group (Me = 28.90 IU/ml). In the group of children with AR, tIgE values ranged from 5.80 to 3242.30 IU/ml (Me = 103.70 IU/ml). Similar tIgE values were observed for the AR alone and AR with asthma groups (p = 0.970); however, these values were significantly higher compared to controls (p < 0.001 for AR; p = 0.001 for AR + asthma).
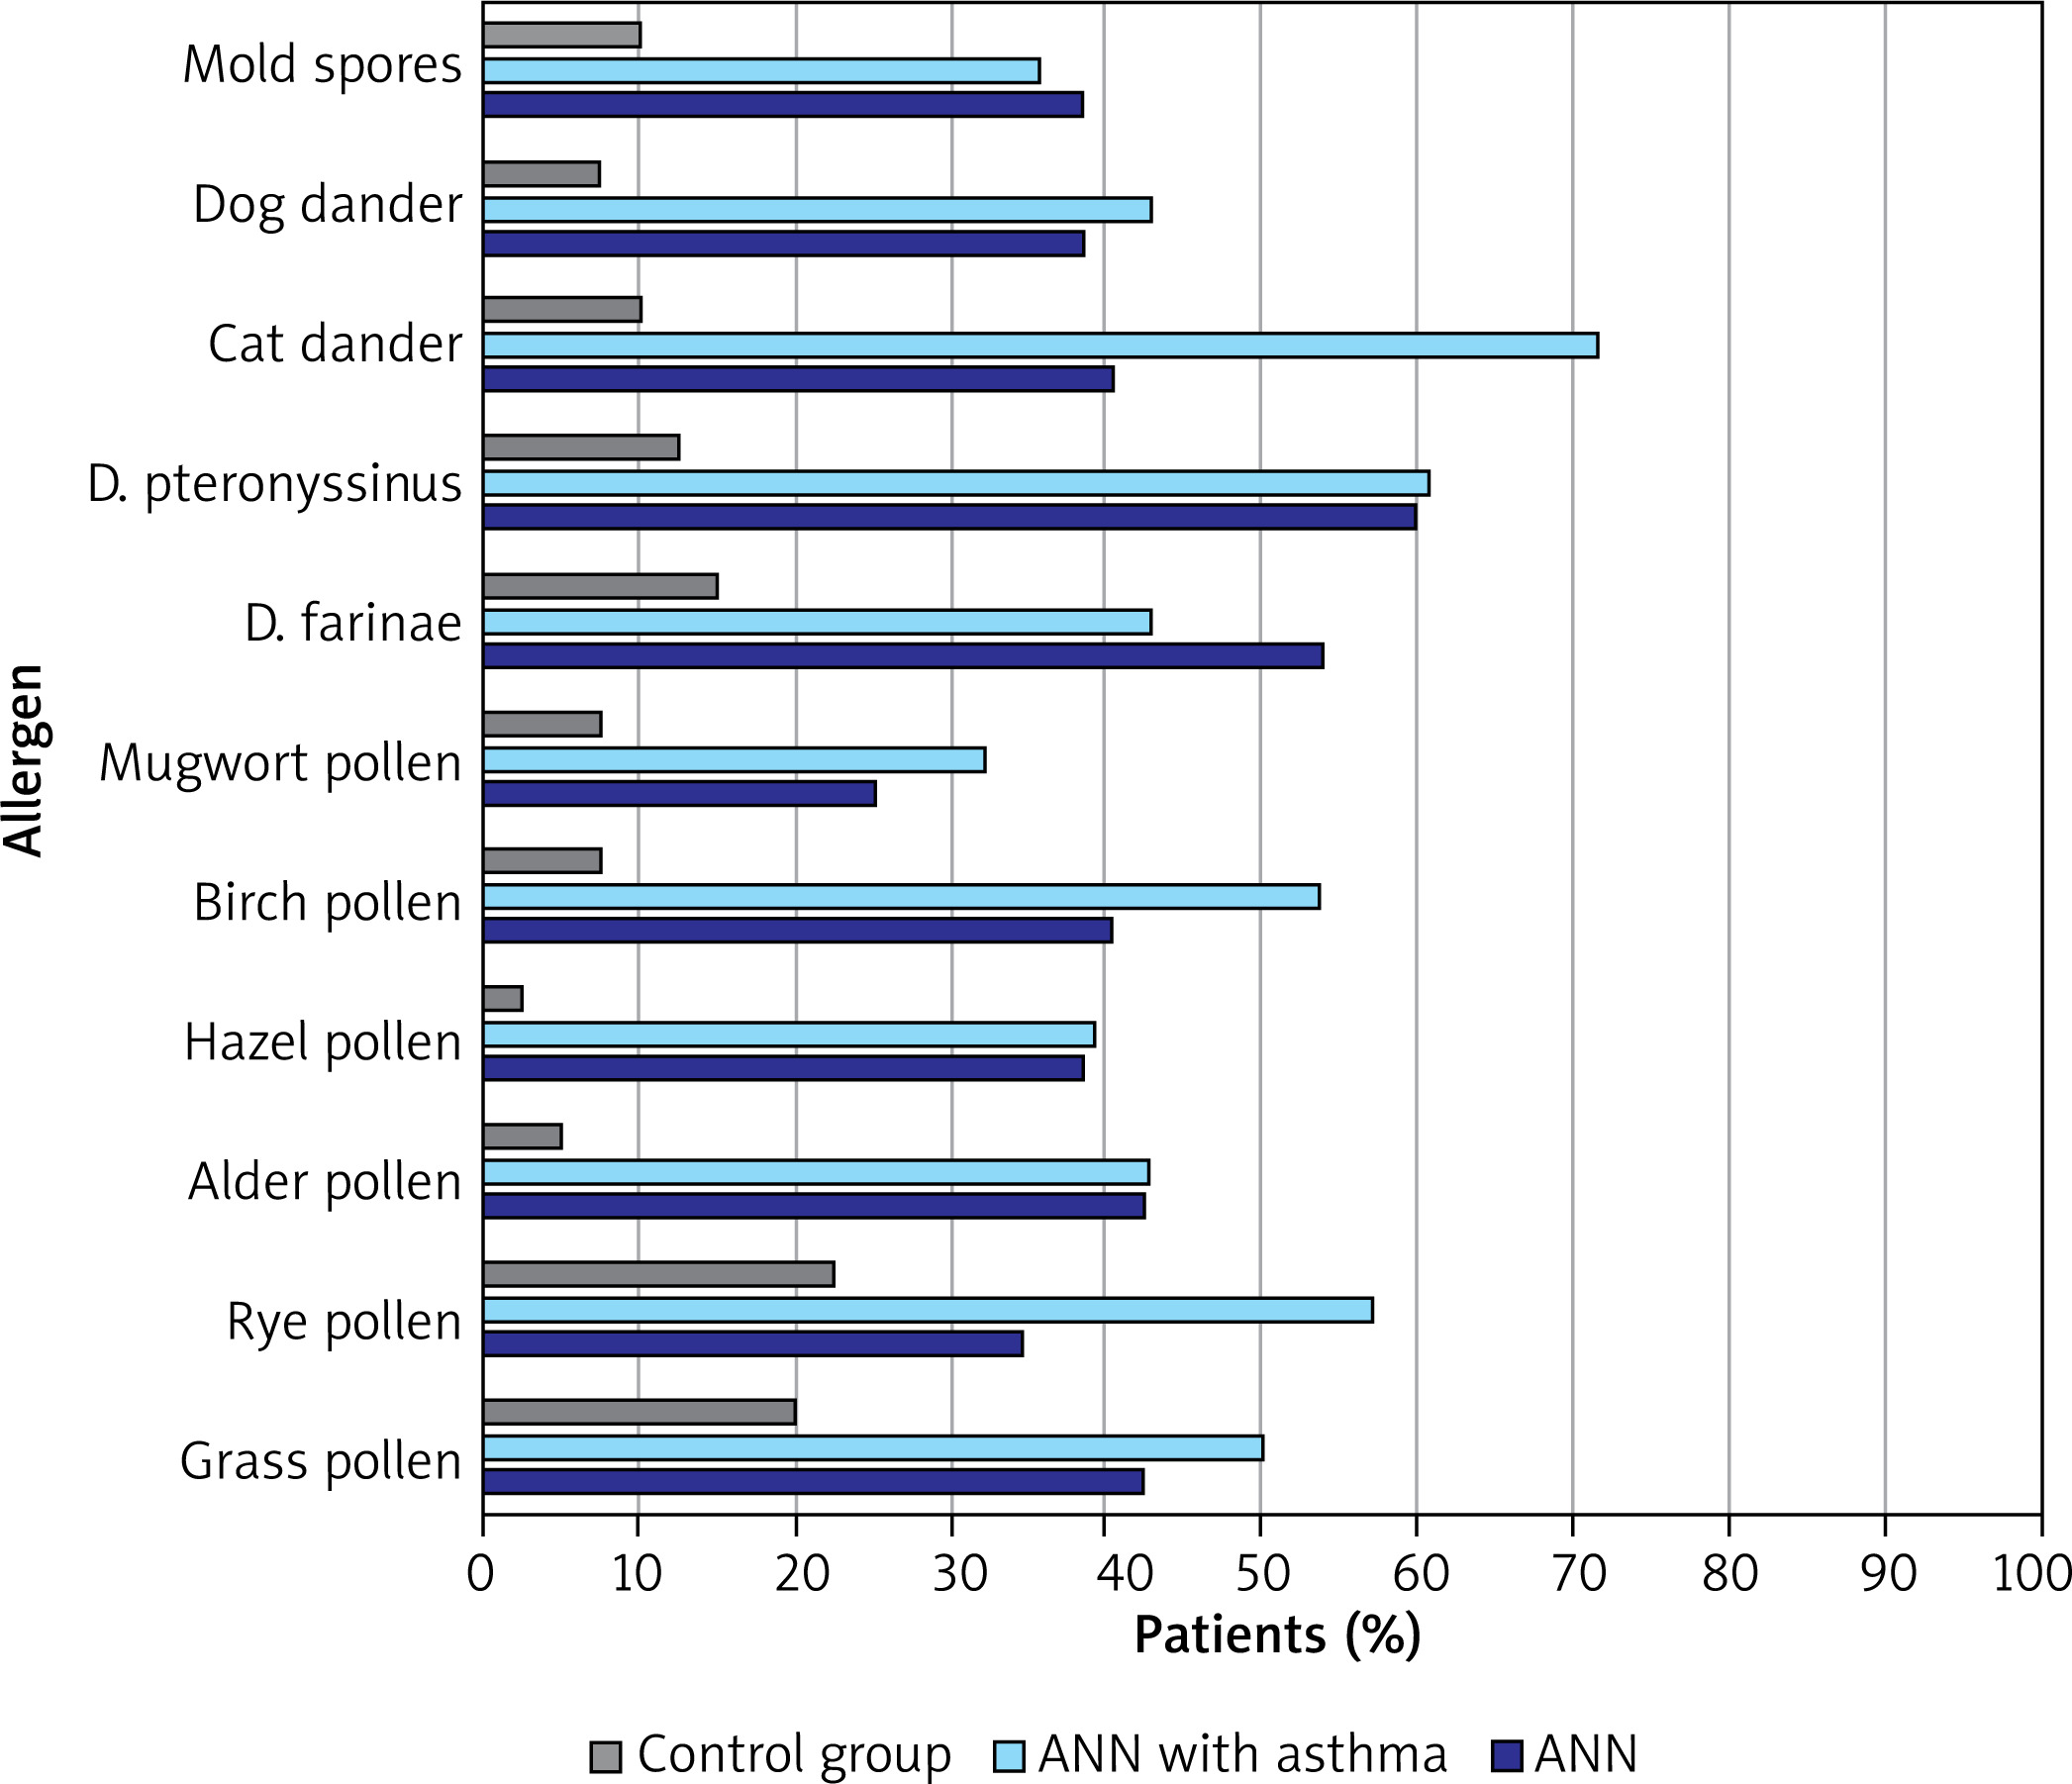
Children with AR were most likely to be allergic (asIgE) to the house dust mites D. farinae (n = 19; 36.54%) and D. pteronyssinus (n = 17; 32.69%), and birch pollen (n = 18; 34, 62%). In patients with AR and asthma, the most common sensitivities (asIgE) were to cat dander (n = 14; 50.00%), dog dander (n = 14; 50.00%) and birch pollen (n = 10; 35.71%). In the control group, the most common sensitivities (asIgE) were to timothy pollen (n = 3; 7.50%), rye pollen (n = 3; 7.50%), and then D. pteronyssinus (n = 2; 5.00%) and D. farinae (n = 2; 5.00%). The frequency of sensitization to individual airborne allergens (SPT) in the study and control groups is shown in Figure 3.
The relationships between lipid profile values and sensitization to airborne allergens (asIgE) and SPT in the study group are presented in Tables 8 and 9.
Table 8
The relationship between asIgE for airborne allergens and TC, HDL, LDL and TG values in the study group
| asIgE [kU/l] | TC | HDL | LDL | TG | |||||||||
|---|---|---|---|---|---|---|---|---|---|---|---|---|---|
| Normal n (%) | Elevated* n (%) | P-value | Low n (%) | Normal n (%) | P-value | Normal n (%) | Elevated* n (%) | P-value | Normal n (%) | Elevated* n (%) | P-value | ||
| Hazel pollen | ≥ 0.35 | 9 (16.36) | 41 (6.00%) | 0.867 | 2 (13.33) | 11 (16.92) | 0.734 | 10 (18.87) | 3 (11.11) | 0.374 | 8 (13.79) | 5 (22.73) | 0.333 |
| < 0.35 | 46 (83.64) | 21 (84.00) | 13 (86.67) | 54 (83.08) | 43 (81.13) | 24 (88.890 | 50 (86.21) | 17 (77.27) | |||||
| Birch pollen | ≥ 0.35 | 14 (25.45) | 11 (44.00) | 0.972 | 5 (33.33) | 20 (30.77) | 0.847 | 15 (28.30) | 10 (37.04) | 0.425 | 18 (31.03) | 7 (31.82) | 0.949 |
| < 0.35 | 41 (74.55) | 14 (56.00) | 10 (66.67) | 45 (69.23) | 38 (71.70) | 17 (62.96) | 40 (68.97) | 15 (68.18) | |||||
| Alder pollen | ≥ 0.35 | 10 (18.18) | 7 (28.00) | 0.320 | 2 (13.33) | 15 (23.08) | 0.406 | 12 (22.64) | 5 (18.52) | 0.667 | 12 (20.69) | 5 (22.73) | 0.842 |
| < 0.35 | 45 (81.82) | 18 (72.00) | 13 (86.67) | 50 (76.92) | 41 (77.36) | 22 (81.48) | 46 (79.31) | 17 (77.27) | |||||
| Mugwort pollen | ≥ 0.35 | 7 (12.73) | 4 (16.00) | 0.694 | 2 (13.33) | 9 (13.85) | 0.959 | 6 (11.32) | 5 (18.520 | 0.376 | 8 (13.79) | 3 (13.64) | 0.986 |
| < 0.35 | 48 (87.27) | 21 (84.00) | 13 (86.67) | 56 (86.15) | 47 (88.68) | 22 (81.48) | 50 (86.21) | 19 (86.36) | |||||
| Timothy grass pollen | ≥ 0.35 | 9 (16.36) | 6 (24.00) | 0.417 | 4 (26.67) | 11 (16.92) | 0.384 | 9 (16.98) | 6 (22.22) | 0.570 | 12 (20.69) | 3 (13.64) | 0.471 |
| < 0.35 | 46 (83.64) | 19 (76.00) | 11 (73.33) | 54 (83.08) | 44 (83.02) | 21 (77.78) | 46 (79.31) | 19 (86.36) | |||||
| Plantain pollen | ≥ 0.35 | 4 (7.27) | 2 (8.00) | 0.909 | – | 6 (9.23) | 0.221 | 4 (7.55) | 2 (7.41) | 0.982 | 4 (6.90) | 2 (9.09) | 0.739 |
| < 0.35 | 51 (92.73) | 23 (92.00) | 15 (100) | 59 (90.77) | 49 (92.45) | 25 (92.59) | 54 (93.10) | 20 (90.91) | |||||
| Rye pollen | ≥ 0.35 | 8 (14.55) | 5 (20.00) | 0.540 | 4 (26.67) | 9 (13.85) | 0.225 | 7 (13.21) | 6 (22.22) | 0.310 | 10 (17.24) | 3 (13.64) | 0.696 |
| < 0.35 | 47 (85.45) | 20 (80.00) | 11 (73.33) | 56 (86.15) | 46 (86.79) | 21 (77.78) | 48 (82.76) | 19 (86.36) | |||||
| D. ptero- nyssinus | ≥ 0.35 | 10 (18.18) | 9 (36.00) | 0.083 | 2 (13.33) | 17 (26.15) | 0.293 | 11 (20.75) | 8 (29.63) | 0.378 | 15 (25.86) | 4 (18.18) | 0.471 |
| < 0.35 | 45 (81.82) | 16 (64.00) | 13 (86.67) | 48 (73.85) | 42 (79.25) | 19 (70.37) | 43 (74.14) | 18 (81.82) | |||||
| D. farinae | ≥ 0.35 | 10 (18.18) | 9 (36.00) | 0.083 | 2 (13.33) | 17 (26.15) | 0.293 | 11 (20.75) | 8 (29.63) | 0.378 | 15 (25.86) | 4 (18.18) | 0.471 |
| < 0.35 | 45 (81.82) | 16 (64.00) | 13 (86.67) | 48 (73.85) | 42 (79.25) | 19 (70.37) | 43 (74.14) | 18 (81.82) | |||||
| Cat dander | ≥ 0.35 | 14 (25.45) | 11 (44.00) | 0.098 | 5 (33.33) | 20 (30.77) | 0.847 | 16 (30.19) | 9 (33.33) | 0.772 | 19 (32.76) | 6 (27.27) | 0.636 |
| < 0.35 | 41 (74.55) | 14 (56.00) | 10 (66.67) | 45 (69.23) | 37 (69.81) | 18 (66.67) | 39 (67.24) | 16 (72.73) | |||||
| Dog dander | ≥ 0.35 | 12 (21.82) | 11 (44.00) | 0.042 | 2 (13.33) | 21 (32.31) | 0.143 | 14 (26.42) | 9 (33.33) | 0.518 | 18 (31.03) | 5 (22.73) | 0.464 |
| < 0.35 | 43 (78.18) | 14 (56.00) | 13 (86.67) | 44 (67.69) | 39 (73.58) | 18 (66.67) | 40 (68.97) | 17 (77.27) | |||||
| A. alternata | ≥ 0.35 | 1 (1.82) | 2 (8.00) | 0.177 | 1 (6.67) | 2 (3.08) | 0.509 | 3 (5.66) | – | 0.208 | 3 (5.17) | – | 0.277 |
| < 0.35 | 54 (98.18) | 23 (92.00) | 14 (93.33) | 63 (96.92) | 50 (94.34) | 27 (100) | 55 (94.83) | 22 (100) | |||||
Table 9
The relationship between skin prick tests for airborne allergens and TC, HDL, LDL and TG values in the study group
| Skin prick test | TC | HDL | LDL | TG | |||||||||
|---|---|---|---|---|---|---|---|---|---|---|---|---|---|
| Normal n (%) | Elevated* n (%) | P-value | Low n (%) | Normal n (%) | P-value | Normal n (%) | Elevated* n (%) | P-value | Normal n (%) | Elevated* n (%) | P-value | ||
| Grass pollen | Positive | 24 (43.64) | 10 (40.00) | 0.760 | 7 (46.67) | 27 (41.54) | 0.717 | 25 (47.17) | 9 (33.33) | 0.237 | 25 (43.10) | 9 (40.91) | 0.859 |
| Negative | 31 (56.36) | 15 (60.00) | 8 (53.33) | 38 (58.46) | 28 (52.83) | 18 (66.67) | 33 (56.90) | 13 (59.09) | |||||
| Rye pollen | Positive | 20 (36.36) | 12 (48.00) | 0.325 | 6 (40.00) | 39 (60.00) | 0.999 | 21 (39.62) | 11 (40.74) | 0.923 | 23 (39.66) | 9 (40.91) | 0.919 |
| Negative | 35 (63.64) | 13 (52.00) | 9 (60.00) | 26 (40.00) | 32 (60.38) | 16 (59.26) | 35 (60.34) | 13 (59.09) | |||||
| Alder pollen | Positive | 17 (30.91) | 10 (40.00) | 0.425 | 6 (40.00) | 21 (32.31) | 0.570 | 17 (32.08) | 10 (37.04) | 0.657 | 17 (29.31) | 10 (45.45) | 0.173 |
| Negative | 38 (69.09) | 15 (60.00) | 9 (60.00) | 44 (67.69) | 36 (67.92) | 17 (62.96) | 41 (70.69) | 12 (54.55) | |||||
| Hazel pollen | Positive | 17 (30.91) | 9 (36.00) | 0.652 | 6 (40.00) | 20 (30.77) | 0.491 | 17 (32.08) | 9 (33.33) | 0.910 | 18 (31.03) | 8 (36.36) | 0.650 |
| Negative | 38 (69.09) | 16 (64.00) | 9 (60.00) | 45 (69.23) | 36 (67.92) | 18 (66.67) | 40 (68.97) | 14 (63.64) | |||||
| Birch pollen | Positive | 22 (40.00) | 12 (48.00) | 0.502 | 4 (26.67) | 30 (46.15) | 0.169 | 22 (41.51) | 12 (44.44) | 0.802 | 37 (63.79) | 13 (59.09) | 0.641 |
| Negative | 33 (60.00) | 13 (52.00) | 11(73.33) | 35 (53.85) | 31 (58.49) | 15 (55.56) | 21 (36.21) | 9 (40.91) | |||||
| Mugwort pollen | Positive | 11 (20.00) | 8 (32.00) | 0.242 | 3 (20.00) | 16 (24.62) | 0.705 | 11 (20.75 | 8 (29.63) | 0.378 | 12 (20.69) | 7 (31.82) | 0.296 |
| Negative | 44 (80.00) | 17 (68.00) | 12(80.00) | 49 (75.38) | 42 (79.25) | 19 (70.37) | 46 (79.31) | 15 (68.18) | |||||
| Plantain pollen | Positive | 12 (21.82) | 6 (24.00) | 0.829 | 5 (33.33) | 13 (20.00) | 0.265 | 13 (24.53) | 5 (18.52) | 0.543 | 12 (20.69) | 6 (27.27) | 0.529 |
| Negative | 43 (78.18) | 9 (36.00) | 10(66.67) | 52 (80.00) | 40 (75.47) | 22 (81.48) | 46 (79.31) | 16 (72.73) | |||||
| D. pteronyssinus | Positive | 23 (41.82) | 18 (72.00) | 0.023 | 6 (40.00) | 35 (53.85) | 0.334 | 25 (47.17) | 16 (59.26) | 0.306 | 28 (48.28) | 13 (59.09) | 0.388 |
| Negative | 32 (58.18) | 7 (28.00) | 9 (60.00) | 30 (46.15) | 28 (52.83) | 11 (40.74) | 30 (51.72) | 9 (40.91) | |||||
| D. farinae | Positive | 21 (38.18) | 13 (52.00) | 0.247 | 6 (40.00) | 28 (43.08) | 0.828 | 21 (39.62) | 13 (48.15) | 0.466 | 25 (43.10) | 9 (40.91) | 0.859 |
| Negative | 34 (61.82) | 12 (88.00) | 9 (60.00) | 37 (56.92) | 32 (60.38) | 14 (51.85) | 33 (56.90) | 13 (59.090 | |||||
| Cat dander | Positive | 21 (38.18) | 13 (52.00) | 0.247 | 7 (46.67) | 27 (41.54) | 0.717 | 22 (41.51) | 12 (44.44) | 0.802 | 22 (37.93) | 13 (59.09) | 0.180 |
| Negative | 34 (61.82) | 12 (48.00) | 8 (53.33) | 38 (58.46) | 31 (58.49) | 15 (55.56) | 36 (62.07) | 10 (45.45) | |||||
| Dog dander | Positive | 17 (30.91) | 10 (40.00) | 0.425 | 4 (26.67) | 23 (35.38) | 0.520 | 15 (28.30) | 12 (44.44) | 0.149 | 16 (27.59) | 11 (50.00) | 0.049 |
| Negative | 38 (69.09) | 15 (60.00) | 11(73.33) | 42 (64.62) | 38 (71.70) | 15 (55.56) | 42 (72.41) | 11 (50.00) | |||||
| Mould spores | Positive | 14 (25.45) | 8 (32.00) | 0.543 | 6 (40.00) | 16 (24.62) | 0.229 | 15 (28.30) | 7 (25.93) | 0.822 | 16 (27.59) | 6 (27.27) | 0.999 |
| Negative | 41 (74.55) | 17 (68.00) | 9 (60.00) | 49 (75.38) | 38 (71.70) | 20 (74.07) | 42 (72.41) | 16 (72.73) | |||||
Children with normal TC levels were less allergic to dog epidermis (asIgE) (p = 0.042) than children with hypercholesterolaemia (Table 8). On the other hand, patients with elevated (i.e. moderately high and high) TC values were more likely to be allergic to D. pteronyssinus (SPT) (p = 0.023) compared to those with normal TC levels (Table 9). Children with normal TG levels were less likely to be allergic to dog dander. Otherwise, no other significant relationships were found between the values of lipid metabolism parameters and the likelihood of sensitization to airborne allergens (p > 0.05).
Discussion
AR is a disease that significantly reduces the quality of life. Its pathogenesis is multifactorial, consisting of a number of obscure genetic and environmental etiological factors. Therefore, there is a pressing need to identify the environmental factors that play an important role in the course of the disease. However, although many studies have examined the coexistence of lipid disorders in children with respiratory tract allergy, none so far have provided a clear picture of the relationship between dyslipidaemia and allergy [15, 17].
Our findings indicate that children with AR alone, children with AR and asthma, and controls without AR have similar TC, LDL and TG values (p > 0.05). Similarly, Panayiotis et al. report no significant differences in TC, LDL or TG levels between children with asthma and healthy children (p > 0.05) [27], and Erela et al. indicate no differences in lipid metabolism parameters (TC, LDL, TG) between adult patients with AR, those with AR and asthma and healthy volunteers (p > 0.05) [28]. In a study of the relationship between BMI and the presence of metabolic disorders (including abnormal lipid profile values) and the occurrence of asthma in school-age children, Cottrell et al. found abnormal blood TG values to be a risk factor for asthma independent of BMI (p = 0.011); however, no similar relationships were found for TC, LDL and HDL [29].
In our study, the children with AR alone or with AR and asthma were more likely to demonstrate normal HDL levels than the non-AR control group (p = 003; p = 0.03, respectively). This is in line with a study in the early 1990s by Shenoi et al., who found that children with AR and children with asthma had higher HDL values than their healthy peers (p < 0.001; p < 0.001, respectively); interestingly, the children with asthma demonstrated significantly higher HDL values at the time of exacerbation than during the period of disease remission (p < 0.01) [30]. In our present study, children with comorbid asthma were examined only in the remission period of the disease.
Vinding et al. found that among children with a positive family history of allergy, higher values of HDL decreased the likelihood of developing AR [17]. In contrast, Erela et al. did not observe any differences in HDL values between adults with AR and asthma, and healthy controls (p > 0.05) [28]. The discrepancies between studies of the lipid metabolism parameters in children with AR alone and with AR and asthma may result from differences in the diets used and, less frequently, in the family burden of hypercholesterolaemia. In the present study, none of the children had first-degree relatives suffering from genetically-determined lipid metabolism disorders. In addition, as more than half of the patients in each group were normogenic, the patients’ diet was not assessed.
Further research on the influence of dyslipidaemia on the development and course of allergic diseases should also address possible functional changes in lipoproteins in patients with AR. It has been shown that HDL particles taken from patients with AR have reduced antioxidative properties and lower secretion of inter alia IL-4 and TNF-α compared to healthy people [31].
Further research is also needed on the potential influence of lipid metabolism disorders on the development of sensitization to airborne allergens, the intensification of eosinophilic inflammation in the respiratory tract and the occurrence of BHR. In the present study, TC and TG values were found to correlate with allergies to perennial allergens (D. pteronyssinus, dog dander). It has been shown that hypercholesterolaemia promotes allergy to the D. pteronyssinus mite, while the correct values of TC and TG may prevent allergy to dog dander.
Kusunoki et al. also note a correlation between lipid metabolism disorders and the occurrence of allergy to airborne allergens in a group of 11-year-old Japanese students [32]. Higher LDL values were associated with sensitization to at least one of the tested airborne allergens (p = 0.003), including house dust mite allergens (p = 0.01). Children with higher TC levels were more likely to be allergic to cedar (p = 0.005) and demonstrate higher tIgE levels (p = 0.04). However, no relationship was found between lipid metabolism parameters and the occurrence of allergic diseases, including AR [32].
In contrast, Sheha et al. found adult patients with AR and dyslipidaemia to be more than four times more likely to have hay dust allergy and three times more likely to have mixed dust allergy compared to adults with AR but without dyslipidaemia [11]. The relationship between hypercholesterolaemia and hypertriglyceridemia and allergy to airborne allergens can be explained by the shift in the immune reaction towards the Th-2-dependent phenotype and the fact that patients genetically predisposed to atopy tend to demonstrate more severe eosinophilic inflammation [33, 34]. It is possible that more frequent occurrence of lipid disorders in patients allergic to perennial allergens, compared to those allergic to seasonal allergens, may result from prolonged exposure to the allergen, causing chronic inflammation. Perhaps the type of the allergen itself, i.e. house dust, is also important for the development of the inflammatory process.
Assuming that dyslipidaemia may be related to the pathogenesis of AR and allergic inflammation, our study also examined the relationship between lipid parameters and the occurrence and severity of BHR, as well as FeNO and nNO values. However, the obtained results did not show any relationship between dyslipidaemia and these factors (p > 0.05). Different research results were obtained by Vinding et al., who observed that in children with AR, higher values of HDL had a preventive effect against sensitization to airborne allergens and were associated with lower FeNO values [17]. In turn, high TG values were a risk factor for the development of allergy to airborne allergens, and these patients demonstrated higher FeNO values [17].
The presented study has also some limitations: a small number of children enrolled in the study, one time point study, one visit during which data were collected and the allergic diagnostic procedure was performed, lack of data concerning children’s diet habits.
Conclusions
AR is a disease with a multifactorial pathogenesis, in which significant contributions are made from both genetic and environmental factors. Dyslipidaemia in AR children is as common as in the general population. However, it has been shown that lipid abnormalities in children with AR may predispose them to sensitization to perennial allergens.
This issue requires further prospective studies, especially those based on multi-centre groups.