Introduction
T lymphocytes, or T cells, act a central regulator of the immune response and play a vital role in the regulation of inflammation [1]. Specific roles of T cells have been detected in various disease states, such as chronic inflammation, tumors, and autoimmune diseases, and several types of T cells have been characterized, including cytotoxic T (Tc) cells, helper T (Th) cells, regulatory T cell (Tregs), γδ T cells, and natural killer (NK) T cells [2]. Although these cell types together account for only a small fraction (10-20%) of immune cells under physiological conditions, they play essential roles in the maintenance of immune homeostasis and are involved in the pathogenesis of various diseases [3]. For example, Tregs regulate immune homeostasis by suppressing the immune response and inducing peripheral tolerance [4].
Cell metabolism is a dynamic process that changes depending on the current bio-energetic requirement of cells [5]. The metabolic, energetic, and biosynthetic requirements of immune cells increase dramatically upon activation of these cells by antigens and mitogens. Establishment of a functional immune response requires rapid and extensive cell growth, proliferation, activation, and production of effector proteins [6]. Studies over the past several decades have revealed that T cells utilize diverse metabolic pathways for energy, molecular biosynthesis, and regulation of their proliferation, activation, differentiation and effector functions [7]. For example, effector T cells become exhausted and promote tumor cell evasion of immunosurveillance [8]. On the other hand, inhibition of glycolysis and glutaminolysis promotes differentiation of Th1 cells into Tregs [8]. Furthermore, Th17 cells are dependent on glycolysis mediated by hypoxia-inducible factor 1α (HIF-1α), and ablation of the HIF-1α pathway reduces the numbers of Th17 cells while increasing the Treg population [9]. Vitamin C reduces apoptosis and promotes proliferation of γδ T cells via increased oxidative respiration and glycolysis, which can enhance γδ T-cell expansion for adoptive immunotherapy [10].
T-cell activation alters cellular metabolism. The transition of T cells from a resting to an active state is accompanied by metabolic changes to meet the increased demands for energy and macromolecular synthesis for cell proliferation and effector functions. Metabolic alterations in activated T cells include increased glucose and glutamine consumption. Glucose and glutamine are metabolized by glycolysis and glutamine catabolism, respectively, to provide metabolic intermediates such as lactate and glutamate [11-13]. T-cell proliferation and activation are closely related to and regulated by metabolism. Therefore, it is necessary to investigate the metabolic fates of T cells and the corresponding impacts on their biological functions in different disease models, to gain insights for the development of novel stra-tegies to restore the functionality of T cells.
T cells undergo metabolic reprogramming to continually satisfy their dynamic energetic and biosynthetic demands throughout their lifespan [14]. Circulating T cells are exposed to hypoxia in healthy and pathophysiological conditions, which may impact their biological activities [15]. Previous research showed that hypoxia reduces the infiltration and activity of CD8 T cells while increasing the activities of Tregs [16]. These effects were positively linked with metabolic changes and reflected metabolic reprogramming in T cells [17, 18]. Therefore, it is necessary to understand the effects of hypoxia on the biological functions of T cells, as this knowledge could enable the development of a targeted strategy for immune therapy for tumors. In the present study, we investigated the influence of anaerobic glycolysis on the proliferation of Jurkat T cells using RNA sequencing to identify proteins and signaling pathways involved in the molecular mechanism by which hypoxia induces metabolism changes in Jurkat T cells. The results of this study may provide insight into the molecular mecha-nism of tumor immune escape, and thereby support the development of novel strategies for tumor immunotherapy.
Material and methods
Cell culture
This study was approved by the Ethics Committee of Qingdao University Hospital. The Jurkat T cell line Clone E6-1 was purchased from Wuhan Procell Life Science & Technology Co, Ltd. RPMI-1640 medium supplemented with 10% fetal bovine serum (FBS; Gibco, USA) was used for cell culture. Cells were cultured in a 5% CO2 atmosphere at 37°C and trypsinized and passaged at a 1 : 3 ratio once they had reached 80% confluence.
Lactate dehydrogenase activity
To measure lactate dehydrogenase (LDH) production by T cells, aliquots of 1 × 10⁵ cells were seeded in 96-well plates and exposed to either dimethyl sulfoxide (DMSO, 0.01%) or different concentrations of the monocarboxylate transporter 1 (MCT1) inhibitor AZD3965 (0, 5, 10, 50, 100, and 500 nM, MedChemExpress, China) to block transmembrane transport of lactate, thereby inhibiting anaerobic glycolysis. After 24 h of treatment, the culture medium was collected and incubated with Lactate Dehydrogenase Activity Assay Kit (Sigma, America) at 37°C for 10 min. The amount of LDH was measured by detection of absorbance at 490 nm with a reference wavelength of 655 nm using a spectrophotometer (Sysmex cube6, Japan).
Cell proliferation cell counting kit-8
Cell proliferation was assessed by cell counting kit-8 (CCK-8) evaluation. Briefly, 1 × 10⁵ Jurkat cells were seeded in 96-well plates and exposed to either DMSO (0.01%) or different concentrations of AZD3965 (0, 5, 10, 50, 100, and 500 nM) for 24 h. The numbers of cells in the wells were detected using the CCK-8 (Dojindo, Tokyo, Japan). Optical density (OD) values at 450 nm were detected using a Multiskan Go spectrophotometer (Thermo Fisher Scientific, USA).
RNA sequencing
For RNA-sequencing analysis, Jurkat Clone E6-1 cells were seeded and exposed to either DMSO or AZD3965 (100 nM) for 24 h. Total RNA was extracted using the Trizol reagent kit (Invitrogen, Carlsbad, CA, USA) according to the manufacturer’s protocol. RNA quality was assessed on an Agilent 2100 Bioanalyzer (Agilent Technologies, Palo Alto, CA, USA) and checked using RNase free agarose gel electrophoresis. Extracted total RNA was treated with Oligo(dT) beads to enrich eukaryotic mRNA. The enriched mRNA was fragmented into short fragments using fragmentation buffer and reverse transcribed into cDNA using the NEBNext Ultra RNA Library Prep Kit for Illumina (NEB #7530, New England Biolabs, Ipswich, MA, USA).
The purified double-stranded cDNA fragments were end repaired, subjected to the addition of an A base, and ligated to Illumina sequencing adapters. The ligation reaction was purified with the AMPure XP Beads (1.0×). Ligated fragments were subjected to size selection by agarose gel electrophoresis and polymerase chain reaction (PCR) amplified. The resulting cDNA library was sequenced using Illumina Novaseq6000 by Gene Denovo Biotechnology Co. (Guangzhou, China).
All high-throughput sequencing image data were converted into sequence data (Reads) by CASAVA base recognition. Reads that were adapter-polluted or of low quality and those in which the number of N bases accounted for > 5% were removed. The data were filtered using Trim-galore software to remove adapters from the sequence. After filtering, the proportion of the sequence that remained for each sample after the quality control step was examined, and the proportion of the sequence that was filtered was plotted. At the same time, a cumulative histogram of the filtering sequence was prepared. The QPhred score was used to measure the sequencing quality. Sequences were judged as having sufficient quality if the average Q20 was ≥ 85% and the average Q30 was ≥ 80%. A histogram of the mean base error rate was gene-rated to reflect the quality of single bases in a sequence. An index of the reference genome was built, and paired-end clean reads were mapped to the reference genome using HISAT2. 2.4 with “-rna-strandness RF” and other parameters set as a default. After the alignment, the aligned genome sequences were assembled and gffcompare software was used to compare the aligned genome sequences with the original genome annotation information to identify new transcripts or new genes of the species. The gffcompare software could classify the transcripts according to the comparison results with the reference transcriptome.
After a series of normalization steps, gene expression levels were measured and quantitatively analyzed by StringTie software. The results are represented in boxplot form. Fragment counts for each gene in each sample were provided by StringTie (Version 2.2.0). For each transcription region, an FPKM (fragments per kilobase of transcript per million mapped reads) value was calculated to quantify its expression abundance and variations, using RSEM software. The calculated gene expression values can be directly used to detect differences in gene expression among samples. The gene expression values were analyzed by principal component analysis (PCA), and the PCA map was drawn. Differential RNA expression analysis was performed using DESeq2 software for comparisons between two different groups (and by edgeR for comparisons between two samples). The genes/transcripts with a false discovery rate (FDR) < 0.05 and an absolute fold change ≥ 1 were considered differentially expressed genes/transcripts.
Bioinformatic analysis
Functional enrichment analysis of the differentially expressed RNAs was performed using David (https://david.ncifcrf.gov/). The statistical significance of each enrichment was assessed by the corrected p-value (Benjamini–Hochberg method). For Gene Ontology (GO) functional enrichment, p-adj < 0.05 was used as the threshold for significant enrichment. From the GO enrichment analysis results, the most significant GO entries in the three components of CC (Cellular Component), BP (Biological Process), and MF (Molecular Function) were selected and combined for preparation of a bar graph and dot graph. For the Kyoto Encyclopedia of Genes and Genomes (KEGG) functional enrichment analysis, p-adj < 0.05 was applied as the threshold for significant enrichment. The signaling pathways were illustrated in histograms and dot plots.
Protein–protein interaction network analysis
String (https://www.string-db.org/) was used to assess the protein–protein interaction (PPI) network. The interaction relationships in the STRING protein interaction database were used to analyze the differential gene–protein interaction network. All significantly differentially expressed genes in each group were mapped to the STRING database, and the PPI network information was extracted, including the names of the interacting proteins and information on the confidence and strength of the binding between pairs. The PPI was constructed from the differentially expressed genes, and the MCODE plug-in of Cytoscape software was used to identify the key nodes in the network. Then the hub genes were imported into Metascape, and the GO and KEGG databases were used for pathway analy-sis. A confidence score > 0.7 was considered statistically significant.
Statistical analysis
Each experiment was repeated at least three times. All statistical analyses were conducted using R (version 3.6.3). Data are expressed as mean ± standard deviation values. Significant differences between two groups were identified by Student’s t-test, with p < 0.05 indicating statistical significance.
Results
Inhibition of anaerobic glycolysis repressed Jurkat T cell proliferation
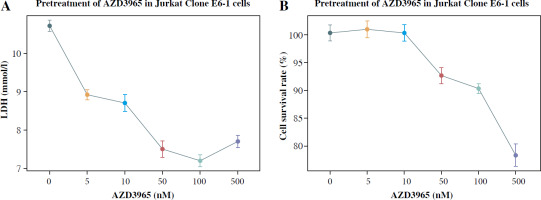
To detect the influence of anaerobic glycolysis on the proliferation of Jurkat T cells, AZD3965 was used to inhibit anaerobic glycolysis. The results showed that AZD3965 treatment decreased the generation of LDH in a dose-dependent manner in the dose range 0-100 nM (Fig. 1A). However, with the higher concentration of 500 nM, no significant further decrease in LDH generation was observed, and cell viability was obviously attenuated. CCK-8 analysis also showed that AZD3965 treatment decreased the rate of cell proliferation in a dose-dependent manner in the dose range 0-100 nM (Fig. 1B). These results indicated that inhibition of anaerobic glycolysis attenuated the proliferation of Jurkat T cells.
Inhibition of anaerobic glycolysis altered the expression profile in Jurkat T cells
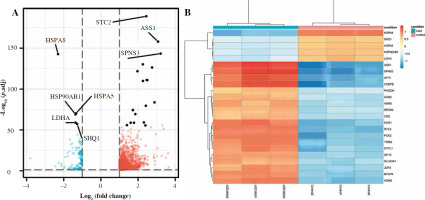
To gain insight into the molecular mechanism underlying the influence of anaerobic glycolysis on Jurkat T-cell proliferation, we conducted transcriptomic sequencing for Jurkat cells treated with or without AZD3965. This ana-lysis identified 1723 genes that were differently expressed with inhibition of anaerobic glycolysis by treatment with AZD3965 (Fig. 2A). Of these, 1460 genes were upregu-lated, including BBC3, SLC6A9, INHBC, BEST1, and HOXB9, and 263 genes were downregulated, including UTP14C, SNORA26, LNX1, and ZNF793 (Fig. 2B). Notably, genes of the heat shock protein (HSP) family, including HSPA8, HSPA5, HSPA1A, and HSPA1B, were also significantly downregulated (Fig. 2B).
Expression of genes regulating cell proliferation was dysregulated upon inhibition of anaerobic glycolysis
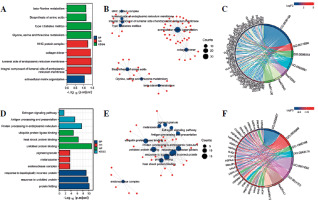
To further analyze the functional importance of the differentially expressed genes, we performed GO enrichment and KEGG pathway analyses (Fig. 3A, B). For the upre-gulated genes, the result of GO analysis showed enrichment for genes involved in extracellular matrix organization. These genes included members of the integrin family (ITGA2B, ITGA7, ITGB4, and ITGB7), collagen family (COL7A1, COL9A2, COL9A3, COL11A2, COL16A1 and others), and human leukocyte antigen (HLA) family (HLA-A, HLA-B, HLA-C, HLA-DQB1, HLA-E, HLA-F, SPPL2B and others) (Fig. 3C). Other genes were involved in the integral component of the endoplasmic reticulum lumen, collagen trimer, and major histocompatibility complex (MHC) protein complex (Fig. 3A, B). Notably, upregulated genes including integrin family members, DPP4, and SMPD3 served as inhibitors of cell proliferation. KEGG pathway enrichment analysis also revealed that the differentially expressed genes were mainly enriched in glycine, serine and threonine metabolism, type I diabetes mellitus, biosynthesis of amino acids, and beta-alanine metabolism (Fig. 3A, B). For the downregulated genes, GO analysis showed enrichment for genes involved in the response to unfolded protein, response to topologically incorrect protein, protein folding, and response to heat (Fig. 3D, E). KEGG pathway enrichment analysis also revealed that the differentially expressed genes were mainly enriched in protein processing in endoplasmic reticulum, antigen processing and presentation, the estrogen signaling pathway, and legionellosis (Fig. 3D, E). Notably, HSP family proteins (HSPA1A, HSPA1B, HSPA8, HSP90AA1, HSP90AB1, HSP90B1 etc.), which can promote cell proliferation, were significantly involved in these processes (Fig. 3F). These results indicate that inhibition of anaerobic glycolysis could impact protein metabolism, extracellular matrix organization, and the expression of genes involved in cell proliferation. Moreover, the estrogen signaling pathway was found to be potentially involved in this process.
Fig. 3
Gene Ontology (GO) and Kyoto Encyclopedia of Genes and Genomes (KEGG) analysis of differentially expressed genes. A) Significantly enriched GO biological processes for the upregulated genes. B) Upregulated genes that contributed to GO and KEGG clusters. C) Chord diagram showing enriched GO and KEGG clusters for the upregulated genes implicated in the regulation of Jurkat T-cell proliferation. In each chord diagram, enriched GO and KEGG clusters are shown on the right, and genes contributing to this enrichment are shown on the left. D) Significantly enriched GO biological processes for the downregulated genes. E) Downregulated genes that contributed to the GO and KEGG clusters. F) Chord diagram showing enriched GO and KEGG clusters for the downregulated genes implicated in the regulation of Jurkat T-cell proliferation. In each chord diagram, enriched GO and KEGG clusters are shown on the right, and genes contributing to this enrichment are shown on the left

PPI network analysis revealed additional functions of dysregulated genes
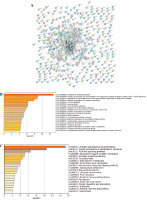
To further analyze the functions of differentially expressed genes, PPI network analysis was performed. As shown in Figure 4A, many hub genes, including HSP family protein genes, ERBB2, UBC, DNAJB1, and NME1-NME2, were identified. To further clarify the functions of these hub genes, GO and KEGG pathway analyses of these genes were performed. The results also showed they were mainly involved in the response to unfolded protein, response to topologically incorrect protein, and protein folding (Fig. 4B). KEGG pathway enrichment analysis also revealed that these hub genes were mainly enriched in antigen processing and presentation, protein processing in endoplasmic reticulum, the PI3K-Akt signaling pathway, neuroactive ligand–receptor interaction, and the estrogen signaling pathway (Fig. 4C).
Discussion
Glycolysis is an essential process for cell activation as it can generate energy for proliferation [19], and the metabolic processes of T cells change under different conditions [20]. Inhibition of anaerobic glycolysis in T cells is known to induce a chronic negative energy balance, and previous research showed that inhibition of anaerobic glycolysis can alter T-cell transcription related to immune responses [21]. In the present study, inhibition of anaerobic glycolysis significantly altered the expression profile in Jurkat cells. We found that the differentially expressed genes were mainly enriched in extracellular structure organization: antigen processing and presentation; glycine, serine and threonine metabolism; and type I diabetes mellitus pathways.
In this study, the MCT1 inhibitor AZD3965 was used to inhibit anaerobic glycolysis in Jurkat T cells. MCTs are proton-linked transmembrane proteins belonging to the solute carrier 16A family and are involved in the influx–efflux mechanisms of monocarboxylates such as lactate and pyruvate [22]. MCT1 optimally imports lactate, and its activity has been linked to cancer aggressiveness and poor outcomes [23]. Cancer cells rely on glycolysis for survival and rapid proliferation in a hypoxic tumor microenvironment [24]. MCT1 is generally overexpressed in different types of cancer cells due to hypoxia [22]. AZD3965, alone or combined with other interventions, successfully decreased tumor growth and promoted intracellular lactate accumulation in animal models [23]. The Phase I study of AZD3965 showed that it was tolerated and demonstrated preliminary antitumor activity in advanced cancers [25].
Intracellular oxygen metabolism is an important factor affecting tumor immunosuppression [26]. The functional activity of T cells is also affected by the local tissue microenvironment, especially changes in oxygen concentration [27]. Many studies have confirmed that the local microenvironment of tumors is hypoxic, as observed in cervical and head and neck squamous cell carcinoma [28]. This hypoxic state can inhibit the activation and prolife-ration of T cells and affect their differentiation into Th1 cells [29]. For example, the hypoxia-activated apoptosis signaling pathway is activated in γδ T cells, thereby inhibiting the anti-tumor function of γδ T cells [30]. Previous research also demonstrated that hypoxia promotes T-cell apoptosis by downregulation of CCR7 [31]. In the present study, we noted that anaerobic glycolysis specifically affected the expression of HSP family genes (HSPA8, HSPA5, HSP90AB1, etc.) as well as the LDHA gene and SHQ1 gene. HSP expression increases when the body is stimulated by hypoxia, and increased expression of these proteins has anti-apoptotic effects [32]. In fact, most HSP genes are targets of HIF-1 [33]. For example, HIF-1 can induce the transcription of Hsp70 under hypoxic conditions [34]. Mechanistically, HSPs can promote cell proliferation through regulation of cell cycle progression by stabilization of cyclinD1-CDK4/6 and cyclinE1-CDK2 [35]. Inhibition of anaerobic glycolysis downregulated the expression of HSPs, which might impact cell cycle progression and decrease the cell proliferation rate. Relevant studies have shown that inhibition of LDHA can activate GCN2-ATF4 signal transduction, reduce the synthesis of intracellular serine and aspartate, and inhibit cell proliferation [36]. Furthermore, SHQ1 is essential to the processing of ribosomal RNAs, the modification of spliceosome small RNAs, and the stabilization of telomerase [37]. Thus, decreased expression of SHQ1 will affect cell proliferation by inhibiting transcription.
The additional genes STC2, SPNS3, and ASS1 were significantly upregulated when anaerobic glycolysis was inhibited in Jurkat T cells. STC2 is a disulfide-bonded homo-dimer secreted glycoprotein that plays a role in various physiological processes such as cellular metabolism, inflammation, endoplasmic reticulum and oxidative stress, calcium regulation, cell proliferation, and apoptosis [38]. STC2 was previously shown to be overexpressed under hypoxia and stress conditions, and to contribute to cell protection and apoptosis inhibition [39]. ASS1 is a urea cycle enzyme that is essential for the conversion of nitrogen from ammonia and aspartate to urea. Previous research showed that overexpression of ASS1 reduces intracellular aspartate levels by downregulating its substrate utilization and lactation [40]. The mammalian target of rapamycin (mTOR) pathway inhibits S6K1 phosphorylation to inhibit activation of CAD (carbamoyl phosphate synthetase 2, aspartate aminotransferase and dihydrogenase complex), thereby reducing pyrimidine synthesis to inhibit cell proliferation. SPNS3 protein is involved in the cell membrane transport of sphingolipids, and its expression level may have predictive significance for the prognosis of acute myeloid leukemia [41]. These dysregulated genes might contribute to the regulation of Jurkat T cell proliferation.
KEGG pathway analysis showed that the differentially expressed genes were enriched in the estrogen signaling pathway. However, after PPI network analysis, KEGG pathway analysis showed that the hub genes were enriched in the PI3K-Akt signaling pathway, which is involved in cell proliferation and apoptosis [42]. Notably, genes involved in this pathway including HSP family members (HSP90AA1, HSP90AB1, and HSP90B1) and CDH2 were significantly down-regulated. Inhibition of the PI3K-Akt signaling pathway impairs activation of the mTOR pathway, which reduces the synthesis of downstream molecules including S6K, 4EBP1 and p34, ultimately inhibiting cell proliferation [43, 44]. Recently, increasing attention has been paid to the impact of the estrogen signaling pathway on T cell proliferation and differentiation [45]. In this study, we also noted that the estrogen signaling pathway was affected by inhibition of anaerobic glycolysis in Jurkat T cells. Previous research showed that proliferation of T cells was significantly affected in mice lacking estrogen receptor alpha (Erα), and Foxp3 expression was increased [46]. Therefore, inhibition of anaerobic glycolysis may inhibit the proliferation of Jurkat T cells through alteration of PI3K-Akt signaling and estrogen signaling.
There are some limitations of this study. The leukemic Jurkat cell line, rather than primary T cells, was used, which may affect the generalization of our results. The Jurkat T cell line is the best-known T-cell model for studying the signaling machinery engaged by T-cell receptors [47]. Moreover, previous research has confirmed that MCT-1 inhibition can also inhibit the proliferation of primary T cells [48]. However, MCT-1 inhibition did not affect processes related to lymphocyte activation, such as cytokine production [48]. Therefore, further studies using primary T cells are needed to investigate the effects of anae-robic glycolysis on lymphocyte activation, which may also be involved in tumor progression.
Conclusions
The present study demonstrated that anaerobic glycoly-sis contributes to the regulation of Jurkat T cell prolife-ration and inhibition of anaerobic glycolysis decreases the proliferation of Jurkat T cells. The underlying mecha-nism may involve dysregulated expression of genes encoding the HSP family members and proteins involved in the PI3K-Akt signaling pathway and estrogen signaling pathway.


