
 POLSKI


INTRODUCTION
Machine learning solutions, which are part of artificial intelligence (AI), are increasingly being used in expert systems. The advancement of deep neural networks allows for the development of effective systems for the classification and segmentation of images, including medical images. Of course, it is important to know that computer systems are not yet able to replace an experienced clinician and final decision-making process. The topic of using AI in ophthalmology is increasingly appearing at ophthalmology conventions and conferences.
An introduction to the application of artificial intelligence concerning ophthalmological practice is presented in the article [1]. The authors discussed basic definitions such as artificial intelligence (AI), machine learning (ML), and deep learning (DL). It has been pointed out that, deep learning techniques are used in the detection of diabetic retinopathy, macular edema, and age-related macular degeneration (AMD), as well as in glaucoma. The article also presents research projects related to the use of AI in pediatric ophthalmic diagnostics.
Most AI-based diagnostic solutions in ophthalmology use the analysis of images obtained with a fundus camera. An analysis of the possibility of using AI for such images is also carried out as part of research projects, e.g., in several research centers in Poland [2-4]. Scientists are also interested in the classification of diseases based on optical coherence tomography (OCT) scans [5, 6] and segmentation of the retinal areas in OCT images [7].
In the coming years, the availability of expert systems to support medical diagnostics, including screening, will become more and more common. Due to the experimental nature of such systems, they are not equipped with a user-friendly interface. Researchers use specialized platforms, such as Anaconda [8] with the interactive Jupyter notepad. Although numerous instructional websites available on the Internet claim that performing image classification is a simple task, involving 10 lines of code [9], this task requires programming skills, including knowledge of the Python programming language.
The article aims to show the mechanisms related to the classification of retinal OCT cross-sections (called B-scans in this paper). Based on open-source solutions, the authors developed software with a simple user interface, making it easier to observe the performance of neural networks on your own. The software is made for educational purposes, showing the possibilities of using machine learning in clinical diagnostics. It is not an indicator of diagnosis.
PUBLICLY AVAILABLE OCT B-SCAN DATASETS
OCT devices (especially SOCT) have been used in ophthalmological diagnostics for several years. However, the number of publicly available datasets of B-scans or their sets (in the case of three-dimensional scanning) is not very numerous. An analysis of ophthalmic datasets presented in [10] shows that of the 94 image sets, only 18 contain OCT B-scans. The following are sets of potential suitability for classification experiments.
Labeled Optical Coherence Tomography (OCT) and Chest X-Ray Images for Classification (LOCT dataset) [11]
The dataset (version 2, most commonly used in experimental studies) contains 84,484 retinal OCT images, divided into 4 classes:
NORMAL – healthy, normative retina,
CNV – choroidal neovascularization,
DME – diabetic macular edema,
DRUSEN – drusen present in the early stages of AMD
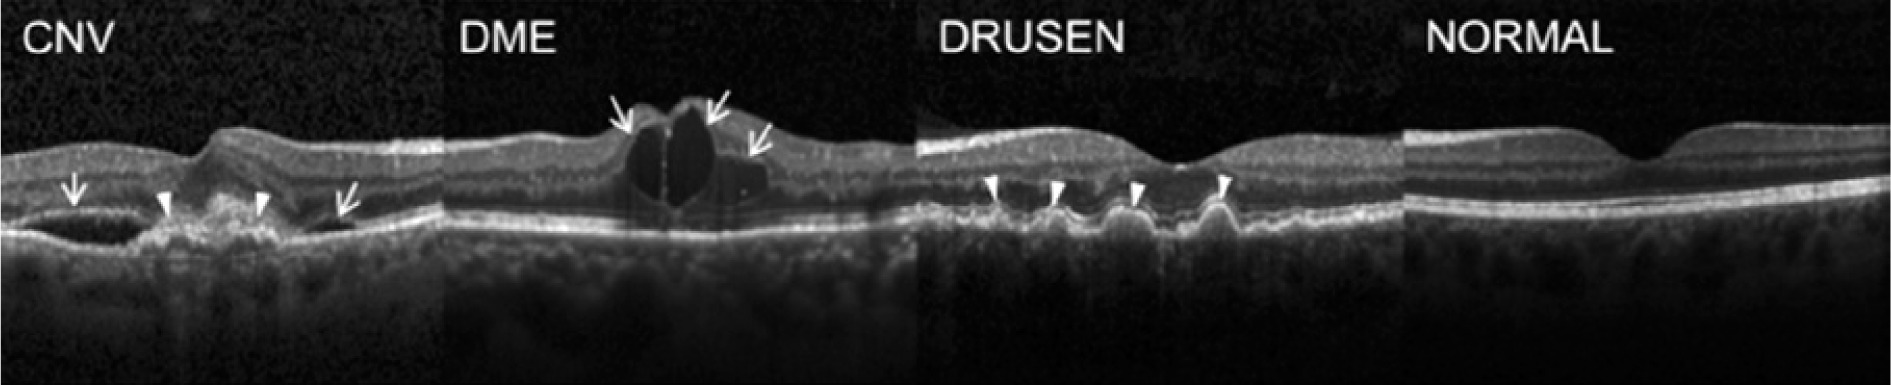
with a proposed division into a training set and a test set. OCT images were acquired between 2013 and 2017 using Spectralis OCT devices (Heidelberg Engineering, Germany) at several centers: Shiley Eye Institute of the University of California San Diego, California Retinal Research Foundation, Medical Center Ophthalmology Associates, Shanghai First People’s Hospital, and Beijing Tongren Eye Center [12]. Images are archived in JPEG format. The size of each class is shown in Table I, and sample images (B-scans) are shown in Figure 1.
Duke OCT [13]
The dataset contains 38,400 OCT scans performed with the Bioptigen SD-OCT Imaging System for two groups of patients: 269 patients with AMD and 115 healthy subjects. The dataset contains semi-automatic segmentation of layers. A certain obstacle in the use of this dataset is the file format (with the .mat extension) for the Matlab environment.
2014 Srinivasan [14]
A collection of 3,231 volumetric scans was obtained from 45 patients: 15 healthy subjects, 15 patients with dry AMD, and 15 patients with DME. A Spectralis SD-OCT device (Heidelberg Engineering Inc.) was used for the acquisition, and the B-scans were saved in TIFF format.
Noor Hospital [15]
The dataset was prepared at the Noor Eye Hospital in Tehran and consists of 50 normal, 48 dry AMD, and 50 DME OCT B-scans. The total number of scans obtained with the Spectralis SD-OCT (Heidelberg Engineering Inc.) is 4,142 and the file format is TIFF.
OCTID: Optical Coherence Tomography Image Retinal Database [16]
The OCTID dataset is decidedly smaller than the previous datasets and contains a set of 470 B-scans, which consist of the following categories: 102 MH, 55 AMD, 107 DR, and 206 NORMAL. The acquisition was made using a Cirrus HD-OCT device (Carl Zeiss Meditec, Inc., Dublin, CA) at Sankara Nethralaya (SN) Eye Hospital in Chennai, India. The dimensions of the scan are 512 × 1024 pixels, with a scanning depth of 2 mm, and the recording format is JPEG.
Table I
Number of images of a given class in individual LOCT subsets
| Training set | Test set | Sum | |
|---|---|---|---|
| NORMAL | 26,315 | 250 | 26,565 |
| CNV | 37,205 | 250 | 37,455 |
| DME | 11,348 | 250 | 11,598 |
| DRUSEN | 8,616 | 250 | 8,866 |
| Sum | 83,484 | 1,000 | 84,484 |
Figure 1
(From left) CNV with neovascular membrane (white arrowheads) and accompanying subretinal fluid (arrows); DME with intraretinal fluid and retinal thickening (arrows); DRUSEN – drusen (arrowheads) present in the early stages of AMD; normal retina with preserved foveal contour and absence of retinal fluid/ swelling [11]
The datasets list presented in [10] dated 2020, and new sets are constantly emerging. An example is the Annotated Retinal OCT Images (AROI) dataset [17]. Because the Labeled Optical Coherence Tomography (OCT) and Chest X-Ray Images for Classification (LOCT) dataset is the most popular and contains the largest number of images, this dataset was chosen for the preparation of the demonstration software.
PREPARATION OF NEURAL NETWORK MODELS FOR CLASSIFICATION OF SELECTED RETINAL DISEASES
A key element of a neural network-based system is the preparation of classification models for use in software. This process, called training, is performed only once during development and the user of the RePatClas software does not have to perform the process themselves. The following description is informative for readers interested in the mechanisms of preparation and operation of such systems. A general scheme for the preparation and use of the software is shown in Figure 2.

The so-called “transfer learning” method was used to develop classification models. It involves the use of trained ready-made models to create a new model dedicated to a selected issue [18]. This procedure is very useful when we have a relatively small set of training data. In the presented case, the authors utilized a neural network model trained to recognize 1,000 categories of objects (such as as “cat”, “dog”, “car”, “house”, etc.) based on color images from the ImageNet dataset [19]. The model was then further trained using OCT images from the LOCT dataset to recognize 4 classes occurring in the images of this dataset. Therefore, it is a task to use previous knowledge to solve a new but similar problem.
In this solution, the authors tested the use of two different deep neural network structures made available via the Keras library together with parameters previously trained with the ImageNet dataset [20]. The first classifier is VGG16 [21] and the second is Inception V3 [22]. Their choice was dictated by their good efficiency in general image classification problems and their availability in public machine learning libraries. Training was carried out according to the instructions prepared by Paul Mooney on the Kaggle website [23].
During the training, efforts were made to avoid the case of overrepresentation of one of the selected groups, i.e., the case in which one of the classes has many more teaching examples than the others, which could lead to a biased model (i.e., preferring that class). For this purpose, 32,000 images from the LOCT training dataset were selected for training, with 8,000 examples for each disease category. In the process of preparing the training image dataset, artificial data augmentation techniques were not used. The only information (apart from the image) fed to the neural network during training is the class number to which the training example should be classified. The analysis is performed only based on the OCT cross-section, without the patient’s identification or statistical data such as age, sex, and medical history.
Since the images in the LOCT dataset are of different sizes and cover different sizes of retina areas, it was decided to scale all images to a single size of 150 × 150 px. Choosing a size several times smaller than the lowest resolution of the images in the LOCT dataset (496 × 512 px) allowed for an additional reduction in the number of neural network parameters necessary for training. In addition, thanks to this procedure, it is possible to perform training (and later prediction) with the use of a standard computer unit. Preliminary studies show that reducing resolution does not adversely affect classification performance.
The models were trained using two different optimizers (methods of fitting model parameters to training data): Adam (adaptive moment estimation) [24] and RMS (Root Mean Squared propagation) [25]. They were chosen for their adaptive selection of network learning parameters and fast convergence, allowing for faster model training. As a result, 4 different variants of the trained models for the classification of retinal OCT images were obtained:
VGG16 with Adam optimizer,
VGG16 with RMS optimizer,
Inception V3 with Adam optimizer,
Inception V3 with RMS optimizer.
The effectiveness of the classification was evaluated using statistical measures of accuracy, sensitivity, and precision defined in a manner typical for machine learning research [26]:
where TP – true positive (examples correctly assigned to a given class), FP – false positive (cases assigned to a given class, but in fact belonging to a different class), TN – true negative (cases rightfully not assigned to a given class), FN – false negative (cases that belong to a given class but have not been assigned to it).
USER INTERFACE
Trained models are a key part of the classification process. Thanks to them, the user can analyze a B-scan image. For this purpose, a special user interface was prepared, of which the prototype version (utilizing only one model) was carried out as part of the work [27].
The software prepared for Windows 10 or 11 allows the user to load a single OCT B-scan image from the computer, display it, and then automatically classify it into one of the 4 classes: NORMAL, CNV, DME, DRUSEN – LOCT dataset classes.
The classification result is displayed in the main window of the application along with the probability of matching each class. The software has been prepared in English for easy dissemination in the international environment.
The user interface of the prepared software includes:
button for selecting an OCT B-scan image for analysis (“Read image”),
area for displaying the uploaded image,
button for starting prediction (“Predict”),
field for displaying the classification result (“Predicted category”).
By pressing the “Read image” button, the user has the option of loading the image for analysis from the computer’s hard drive. The loaded image is displayed in a gray box on the right side of the window. After pressing the “Predict” button, the program processes the image using the trained models provided with the software. Once the processing is complete, the result of the classification is displayed in the box that says “Predicted category” at the bottom of the window.
The class with the highest percentage probability is indicated as the best fit (in the “Best fit” row). Other classes and their probability assignments are given in the row below (“Other classes”). Currently, the software calculates probabilities according to the multi-class classification method, i.e., assigns the image to one of the given classes. The probabilities of all classes sum up to 100%.
The software allows you to read images in JPG, BMP, and PNG formats. It is possible to extend the operation of the program with the option of classifying a set of multiple OCT images from a user-specified directory, i.e., the so-called “batch processing”.
As mentioned in the previous section, the software uses image classifiers based on learned mathematical models in the form of deep neural networks. As a result, the classifier indicates the probability of the selected OCT cross-section belonging to each of the 4 classes mentioned above. To present the discrepancies of classification depending on the model, the 4 classification models mentioned in the previous section are included with the software. The software makes a prediction using each of the models separately so that the user can compare the results. In the next part of the article, the classification efficiencies of the available models obtained with LOCT dataset are described.
Figure 3 shows the classification result for a sample image displayed at the bottom of the program window. It presents the tested image assigned to the DRUSEN class with a probability from 85.7 % (using the VGG16 + RMS model) to even 100 % (using the Inception V3 models). The probability of the image belonging to the other classes included in the test is shown below.
Figure 3
A view of the program window with a sample OCT image to be analyzed and the result of classification using 4 models

The software was developed as part of research work carried out at the Division of Electronic Systems and Signal Processing, Poznan University of Technology. It is available free of charge for non-commercial use for research and scientific purposes on the Division’s website [28]. The software includes trained neural network models and sample test images from the LOCT dataset. The software cannot be used to diagnose or treat patients.
RESULTS
A test dataset containing 250 examples of OCT cross-sections for each class was used to test the developed models. It should be noted that 8 files from each class were used for validation in the training process. This adds up to a total of 968 test files, all of which were from different patients.
Figure 4 presents confusion matrices [25], which illustrate the correctness of the operation of individual neural network models. Ideally, the values on the diagonal should reach a value of 242 (equal to the number of test examples for each class). As can be seen from the presented matrices, the values of the VGG16 network contain fewer classification errors than in the case of the Inception network.
Figure 4
Confusion matrices for analyzed neural network models: A) VGG16 network + Adam optimizer; B) VGG16 network + RMS optimizer; C) Inception V3 network + Adam optimizer; D) Inception V3 network + RMS optimizer

Statistical evaluation of neural networks in relation to detected classes was performed. The Pearson’s χ2 test was used, which resulted in a p-value of 0.9839 (the result is not statistically significant, with a significance level of 0.05).
Figure 5 shows a bar graph that illustrates the accuracy of the classification for each of the tested models.

The analysis of the results shows that the highest accuracy for the tested images is achieved by the VGG16 + RMS model (96.28%), while a similar accuracy can be obtained by using the VGG16 + Adam classifier (96.18%). Inception V3 + Adam (89.36%) and Inception V3 + RMS (91.01%) are less efficient.
The results of the statistical analysis, considering the precision and sensitivity of the models, are presented in Table II. The values highlighted in bold indicate that the VGG16 + Adam model is characterized by the highest precision for the NORMAL and CNV classes and the VGG16 + RMS model for the DME and DRUSEN classes. The sensitivity of the VGG16 models is higher than that of the Inception V3 models (except for the DRUSEN class) regardless of the optimizer used. As with the accuracy values, the precision and sensitivity of the Inception V3 + Adam are lower compared to the other models.
Table II
Statistical results of the classification of diseases obtained for the test set
The inaccuracy of the obtained classification result is related to the degree of development of the neural network and the selection of optimization functions during training. Factors that reduce the effectiveness of the test include noise in the OCT image, OCT device model, and image acquisition errors (including blurred image, partial obscuration of retinal tissues, narrow pupil, etc.).
Due to the use of images from the public OCT dataset [11], collected using the Heidelberg Spectralis device, the developed models are suitable for images with a brightness distribution characteristic for these devices. As a result, the classification results obtained with the developed models may differ when testing OCT B-scans obtained using devices from other manufacturers. The problems related to this are presented, m.in, in the article [29].
In summary, the obtained classification results show a relatively high efficiency of neural network-based classification models, indicating the possibility of using them in the future to support decisions in clinical diagnostics.
SUMMARY
Automatic detection and classification of retinal lesions is one of the challenges in medical image analysis. Expert systems for the classification of retinal diseases based on deep neural networks are currently in the development and experimental testing phase.
The prepared RePatClas software, based on open-source solutions, is educational and allows for independent evaluation of the effectiveness of four neural network models using images obtained from the Heidelberg Spectralis OCT device. The software is in the development phase, and the authors intend to extend it with new classes and the construction of other models in cooperation with ophthalmology specialists.